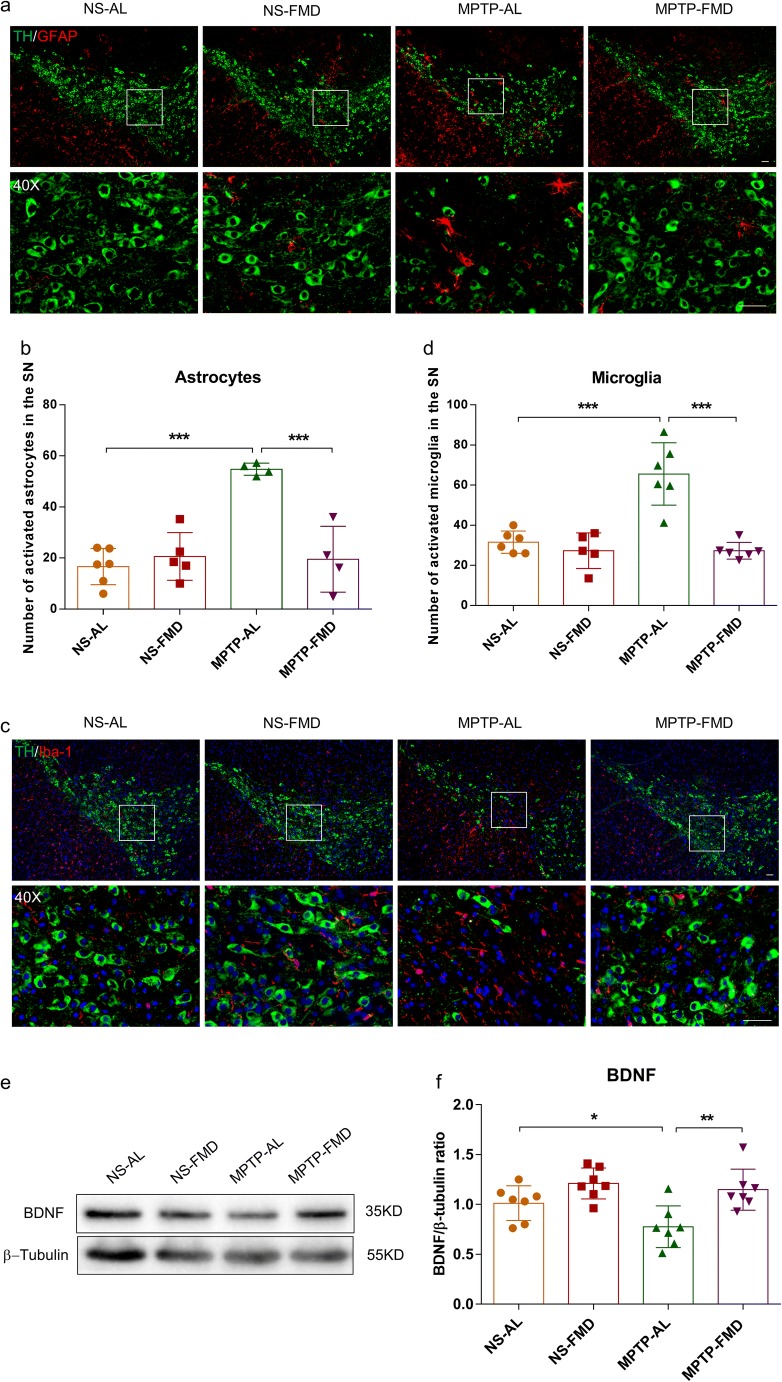
Fig. 4.
FMD alleviates MPTP-induced neuro-inflammation by retaining BDNF levels. (a) Double immunofluorescence staining for TH (green) and GFAP (red) in the SN. Scale bar is 100 μm. (b) Quantitative analysis of the number of GFAP positive cells in each group, F3,15 = 18.574, p < 0.001. NS-AL group (n = 6), NS-FMD group (n = 5), MPTP-AL group (n = 4), and MPTP-FMD group (n = 4). (c) Double immunofluorescence staining of TH (green) and Iba-1 (red) in the SN. Scale bar is 100 μm. (d) Quantitative analysis of the number of microglia in each group, F3,19 = 21.832, p < 0.001. NS-FMD group (n = 5), n = 6 mice in the other three groups. (e) Representative western blot of striatal BDNF expression. (f) Band intensity was quantified with the ImageJ software and quantitative data for TH following normalization to GAPDH, F3,24 = 7.375, p = 0.001, n = 7 mice per group. (g) ELISA for striatal TNF-α expression, F3,28 = 6.316, p = 0.002, n = 8 mice per group. (h) ELISA for striatal IL-1β expression, F3,20 = 13.529, p < 0.001, n = 6 mice per group. Statistical comparison by one-way ANOVA with post hoc comparisons of LSD; data represent the means ± SEM; *p < 0.05, **p < 0.01, ***p < 0.001

