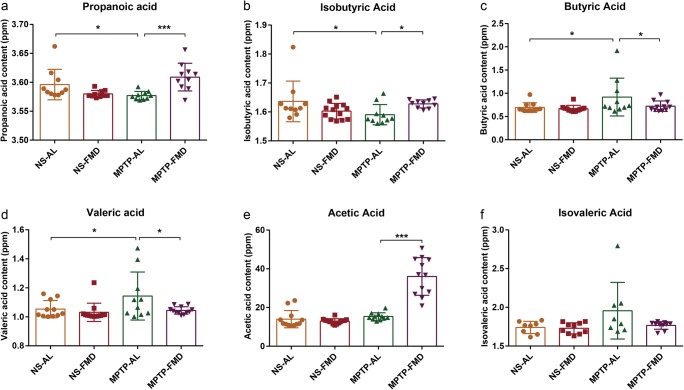
Fig. 8.
Fecal SCFAs alterations in mice. (a) Concentration of fecal propionic acid, F3,45 = 3.055, p = 0.038. (b) Concentration of fecal isobutyric acid, F3,45 = 3.089, p = 0.036. (c) Concentration of fecal butyric acid, F3,45 = 3.038, p = 0.049. (d) Concentration of fecal valeric acid, F3,45 = 3.072, p = 0.037. (e) Concentration of fecal acetic acid, F3,45 = 50.632, p < 0.001. (f) Concentration of fecal isovaleric acid, F3,45 = 0.952, p = 0.424. Statistical comparison by one-way ANOVA with post hoc comparisons of LSD; data represent the means ± SEM; *p < 0.05, **p < 0.01, ***p < 0.001. NS-AL group (n = 12), NS-FMD group (n = 14), MPTP-AL group (n = 11), MPTP-FMD group (n = 12)

