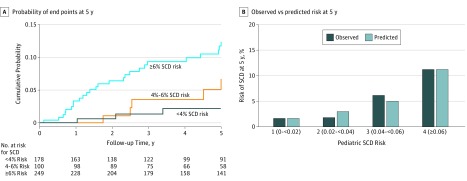
Figure. Performance of the HCM Risk-Kids Model.
A, Kaplan-Meier curve showing cumulative probability of sudden cardiac death (SCD) end points within 5 years of baseline evaluation by clinical risk groups calculated by the pediatric SCD risk model. Patients with complete data for the calculation of 5-year SCD risk estimates (n = 527) were classified into 3 risk groups (<4%, 4%-<6%, and ≥6%). B, Comparison of observed and predicted risk by clinical risk group of the pediatric SCD risk model (for 1 imputed data set). Vertical bars represent observed (dark blue) and model-based predicted (light blue) probability of SCD by 5 years. HCM indicates hypertrophic cardiomyopathy.

