
Figure 3.
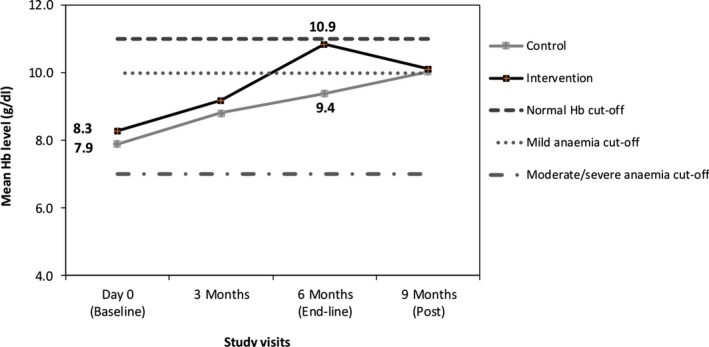
Changes in mean hemoglobin level in the control and intervention sites during intervention and postintervention period
Official websites use .gov
A
.gov website belongs to an official
government organization in the United States.
Secure .gov websites use HTTPS
A lock (
) or https:// means you've safely
connected to the .gov website. Share sensitive
information only on official, secure websites.
Changes in mean hemoglobin level in the control and intervention sites during intervention and postintervention period