Figure 1.

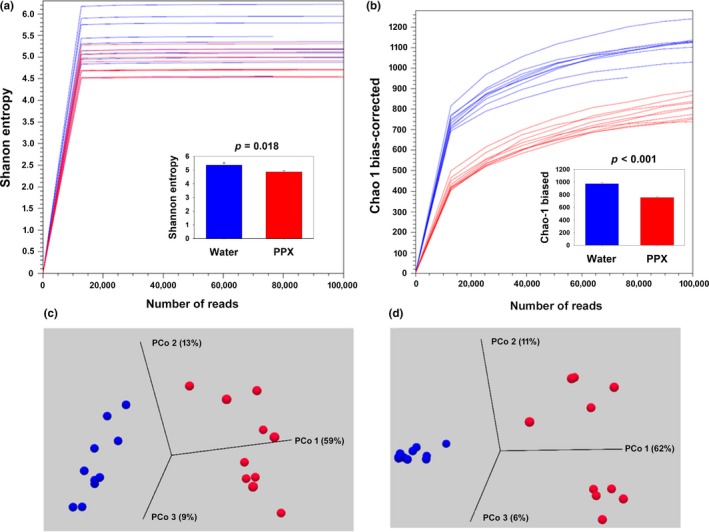
Alpha‐ and beta‐diversity plots for water‐ or PPX‐treated mice. Mice were orally gavaged with water or PPX for 14 days and fecal pellets collected for 16S rRNA gene analysis. Within sample, phylogenetic diversity was quantified using measures of alpha diversity, (a) Shannon entropy, and (b) Chao‐1 bias‐corrected plots. The mean diversity values are plotted in the inset, and there is a significant reduction in diversity in the PPX samples compared water. The bar graphs show the mean ± SE of values obtained with samples rarefied to 73,684 reads. Beta diversity measured using the (c) weighted UniFrac or (d) Bray–Curtis dissimilarity plot showed distinct separation of water and PPX samples with PCo1 accounting for 59% and 62%, and PCo2 13 and 11% of the diversity, respectively. Blue lines, spheres, and bars—water‐treated samples; Red lines, spheres, and bars—PPX‐treated samples
