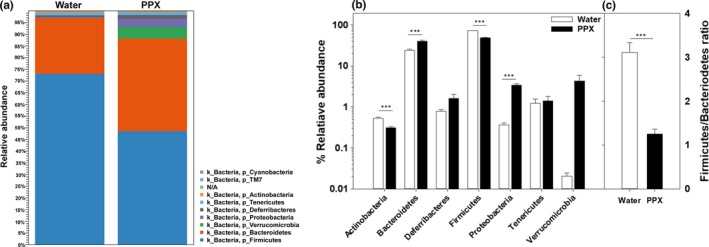
Figure 2.

Relative abundance of bacterial phyla in water‐ and PPX‐treated mice. Fecal samples were analyzed for the relative abundance of various phyla, and the results are shown as a stackplot in panel a. A bar plot showing statistical significance of different phyla is shown in panel b, and panel c shows the decrease in the Firmicutes/Bacteroidetes ratio in PPX‐treated mice. ***indicates p < 0.001
