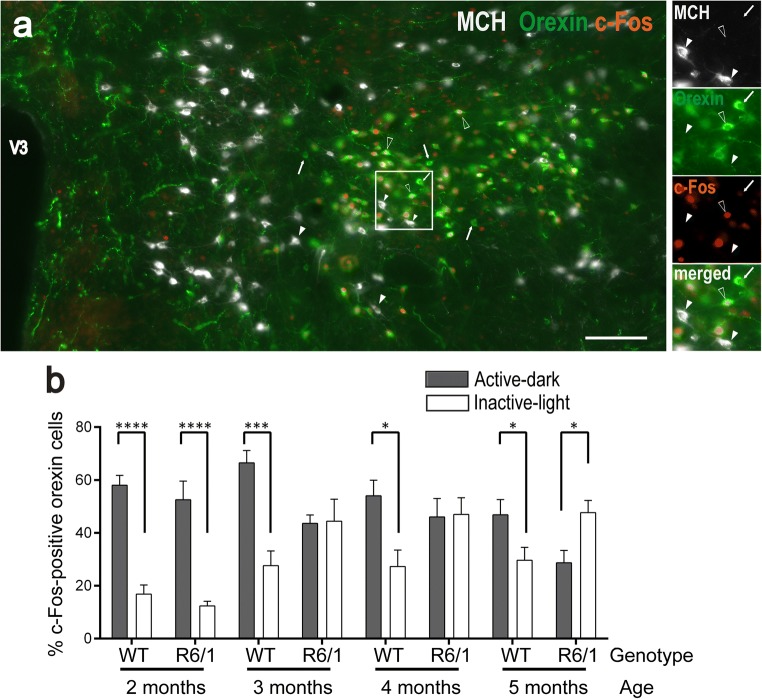
Fig. 1.
Orexin neuron activity during active (dark) and inactive (light) behavioral periods in R6/1 and WT littermates from 2 to 5 months of age. a Representative coronal section of the lateral hypothalamus from a 2-month-old WT mouse sacrificed during its active period and labeled for MCH (gray), orexin (green), and c-Fos (red). The image shows large groups of Orx-positive neurons (white arrow) surrounded by MCH-positive cells (white arrowheads). While c-Fos was detectable in a number of Orx-containing neurons (empty arrowheads), only a negligible proportion (< 1%) of MCH neurons were c-Fos+. White frame detailed in right insets displays MCH-, orexin-, c-Fos-, and merge-labeling. V3, third ventricle. Scale bar, 100 μm. b Data (mean ± SEM) were expressed as mean percentage of c-Fos immunoreactive neurons among Orx immunoreactive cells during the active (gray bars) or inactive (white bars) periods. *p < .05, ***p < .001, ****p < .0001 by unpaired t test

