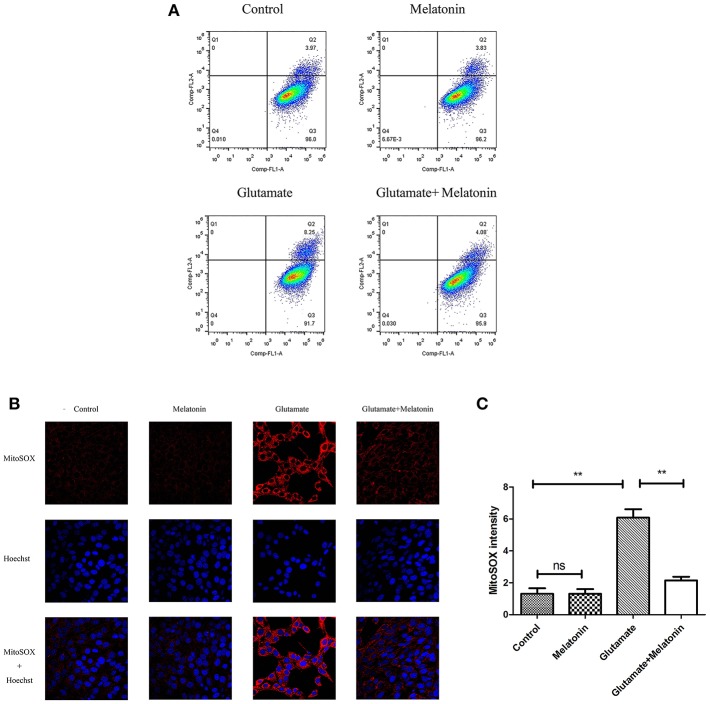
Figure 6.
Effect of melatonin on mitochondrial reactive oxygen species (ROS) accumulation in cells. (A) Detection of ROS content in mitochondria using flow cytometry; (B) Fluorescence intensity of ROS in mitochondria; (C) Quantitative analysis of average fluorescence intensity of ROS in mitochondria: F = 24.903, P < 0.001; control group vs. glutamate injury group: P < 0.001, glutamate injury group vs. melatonin pretreatment group: P < 0.001; **P < 0.01. ns, not significant (n = 6/group).

