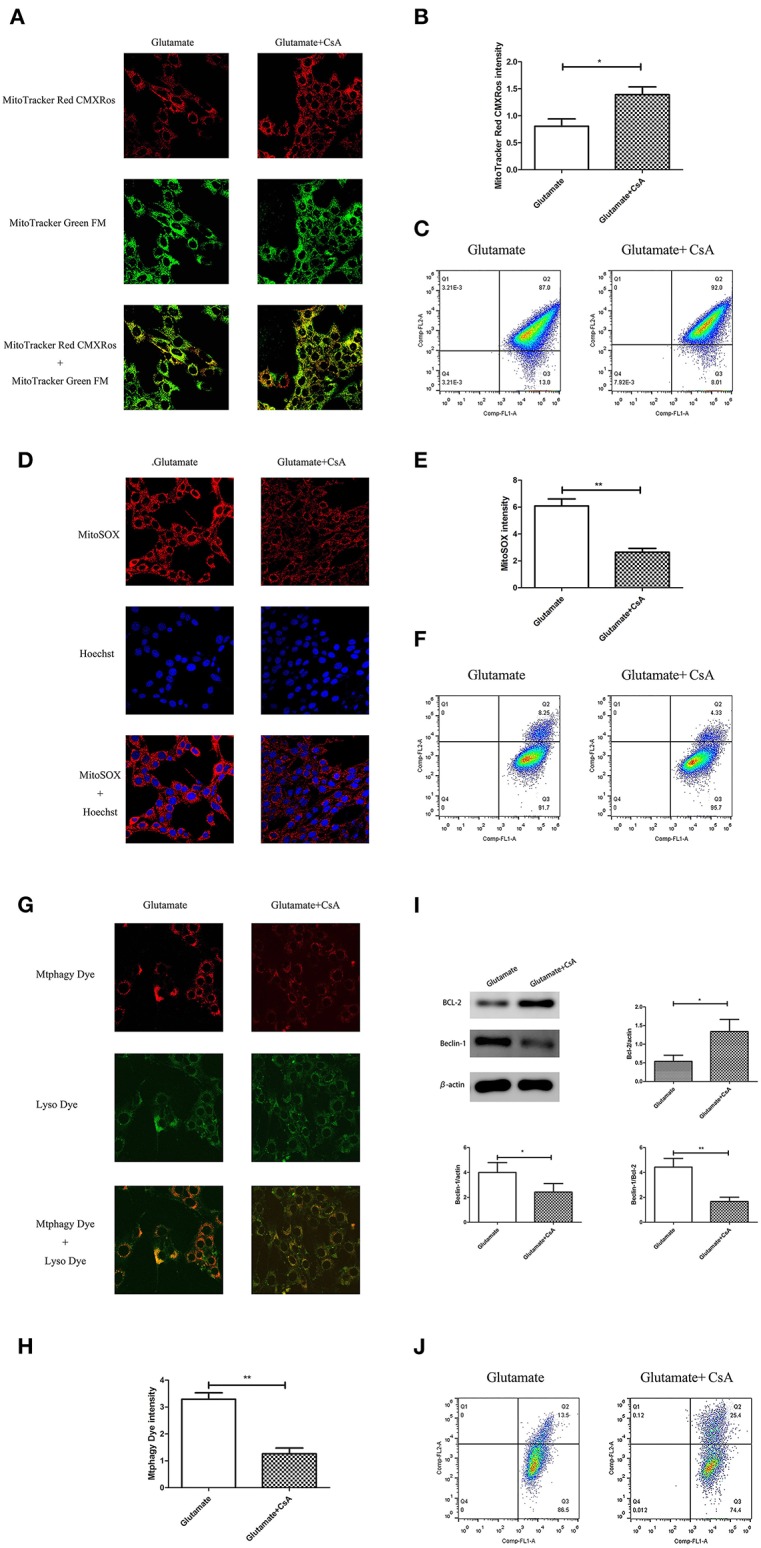
Figure 9.

Effect of cyclosporine A (CsA) on glutamate-induced mitochondrial autophagy. (A) Fluorescence intensity of Mito-Tracker Red CMXROS in cells; (B) Quantitative analyses of mean fluorescence intensity of Mito-Tracker Red CMXROS in cells: t = 3.074, P = 0.012; (C) Mitochondrial membrane potential was detected using flow cytometry and Mito-Tracker; (D) Fluorescence intensity of mitochondrial ROS; (E) Quantitative analysis of mean fluorescence intensity of mitochondrial ROS: t = 4.511, P = 0.001; (F) Detection of ROS content in cell mitochondria using flow cytometry; (G) Fluorescence intensity of mitochondrial Mtphagy Dye and Lyso Dye in cells; (H) Quantitative analyses of mean fluorescence intensity of mitochondrial Mtphagy Dye in cells: t = 5.687, P < 0.001; (I) Expression of mitochondrial autophagy-related proteins in cells: Bcl-2/actin: t = 2.799, P = 0.019; Beclin-1/actin: t = 2.856, P = 0.017; Beclin-1/Bcl-2: t = 4.218, P = 0.002; (J) Observation of mitochondrial membrane potential changes using JC-1. *P < 0.05, **P < 0.01 (n = 6/group).
