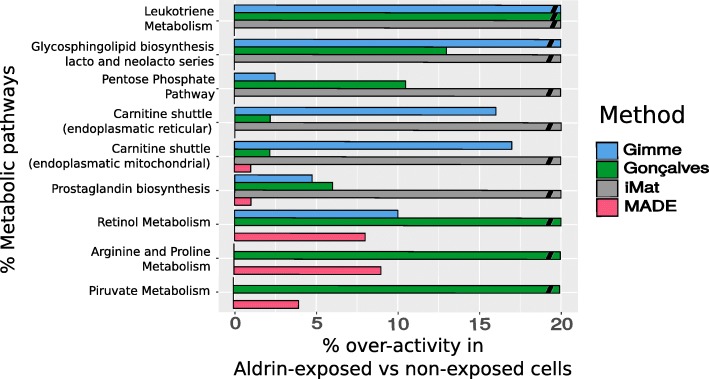
Fig. 3.
Pathways over-activation predicted in each method. Bars represent the % of pathway over-activity in Aldrin-exposed cells compared with non-exposed cells (n° of active reactions in Aldrin-exposed cells/n° of active reactions in non-exposed cells). The non-continuous bars indicate that a given pathway is predicted to be active only in Aldrin-exposed cells. Its significance was tested with a t-test [28] (p-value < 0.05)

