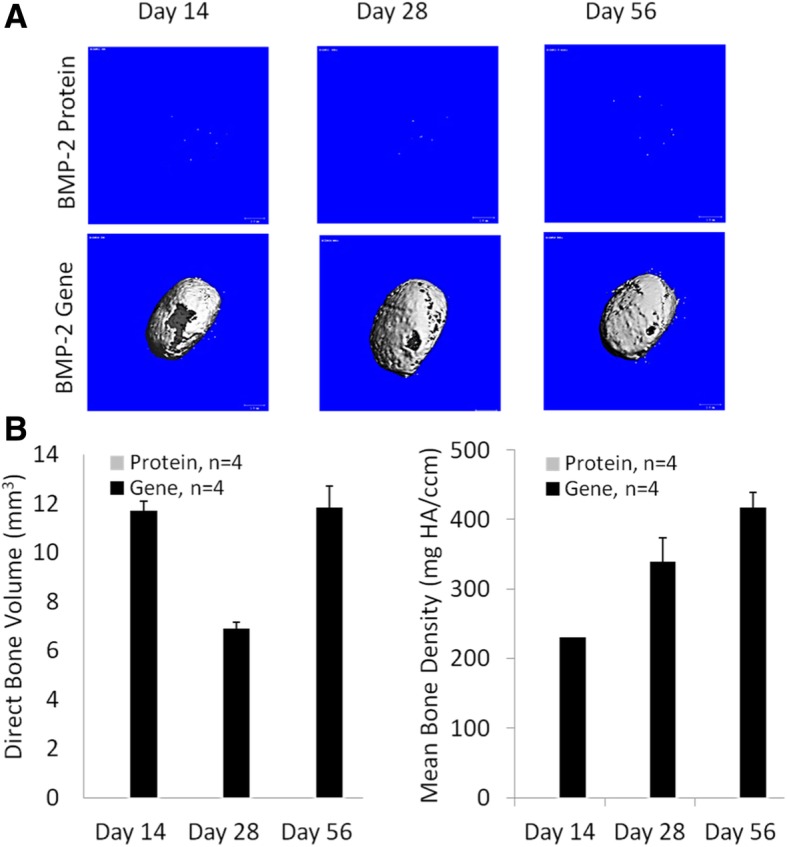
Fig. 4.

The micro-CT images and the bone volume and density of constructs at days 14, 28 and 56 days after implantation. a Representative reconstituted 3D micro-CT imaging from two groups at different time points. b Direct bone volume and mean bone density of new bone tissues in the Gene group at days 14, 28, and 56. (n = 4)
