Fig. 4.
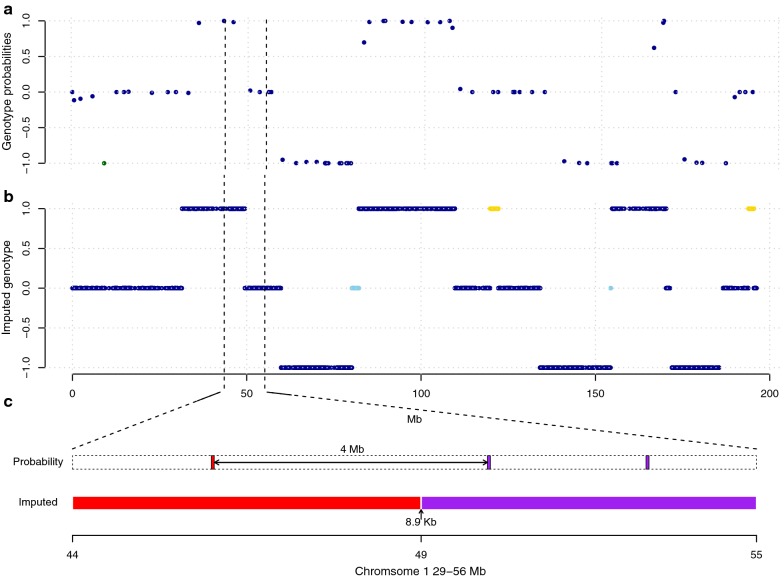
Similarity between the founder mosaic genotypes inferred from low-coverage sequence data and genotype probabilities estimated from sparse individual genotypes across chromosome 1 for one F2 chicken [20]. a Genotype probabilities estimated by Wahlberg et al. [20] using the algorithm described by Haley et al. [31] provided at the locations of the 74 SNPs and microsatellite markers genotyped in this pedigree. The green dot illustrates a genotype that disagrees with those imputed from sequence data. b Imputed genotypes from the low-coverage sequence data, where the colours of the dots indicate genotypes for which the two methods agree (dark blue), and expected heterozygous genotypes resolved (light blue) or novel putative double recombinant genotypes suggested (yellow) by imputing genotypes from the sequence data. c Illustration of the increased resolution from sequence-based inference of the founder mosaic for one recombination breakpoint on chromosome 1 (between 44 and 55 Mb). Genotype probabilities inferred from SNP and microsatellite data and our pipeline are illustrated as coloured bars, where red/purple indicate homozygous/heterozygous for the HWS allele, respectively

