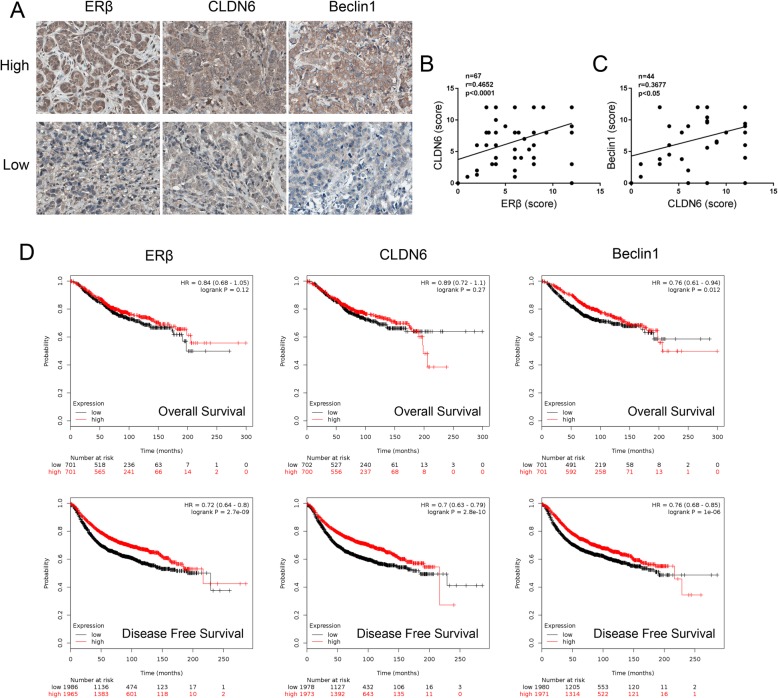
Fig. 7.
Clinical correlation analyses between ERβ, CLDN6 and beclin1 expression and prognosis in breast cancer patients. a Representative images of IHC analysis of ERβ, CLDN6 and beclin1 expression from tissue microarray (× 400). In breast cancer tissues and adjacent tissues, ERβ expression was observed in the nucleus and the cytoplasm, CLDN6 was expressed in the cytoplasm and the plasma membrane and beclin1 was mainly expressed in the cytoplasm. “Low” indicates proteins with low expression, and “high” indicates proteins with high expression. b Correlation between ERβ expression and CLDN6 expression in breast cancer tissue microarray. Pearson correlation test, n = 67, r = 0.4652, P < 0.0001. c Correlation between CLDN6 expression and beclin1 expression in breast cancer tissue microarray. Pearson correlation test, n = 44, r = 0.3677, P = 0.0141. d Kaplan-Meier analysis of the overall survival and disease-free survival of breast cancer patients with different ERβ, CLDN6 and beclin1 expression levels in the in Kaplan-Meier plotter database. Statistical differences were determined by log-rank test. Data are presented as mean ± SD

