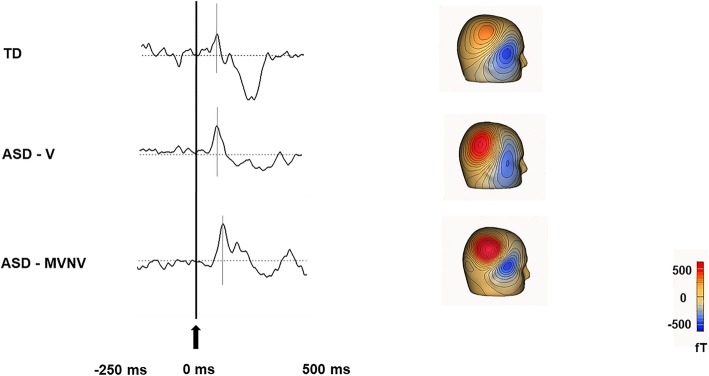
Fig. 1.
Source modeled activity waveform from right superior temporal gyrus for a representative participant in each group. Black vertical lines on the waveform and arrow indicate stimulus onset (0 ms). Gray lines indicate M50 peaks: for the representative TD marked at 71 ms, for the representative ASD-V child marked at 81 ms, and for the representative ASD-MVNV child marked at 98 ms. A clear prolongation of latency is observed in ASD-V, which is exacerbated in ASD-MVNV

