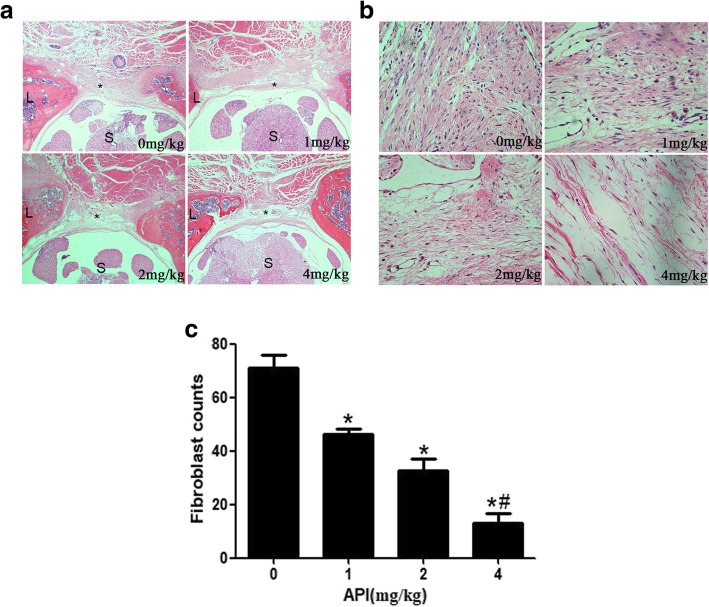
Fig. 3.
Photomicrographs of epidural fibrosis at laminectomy sites at × 40 magnification was selected from the API-treated groups and control group (a). Fibrotic tissue was marked as “*,” the spinal cord was marked as “S,” and laminectomy was marked as “L.” Photomicrographs of fibroblast density at × 400 magnification demonstrated a marked reduction in the API-treated groups (b). The number of fibroblasts is presented in the bar graph (c). *P < 0.05 versus the control group. #P < 0.05 compared to the other API-treated groups

