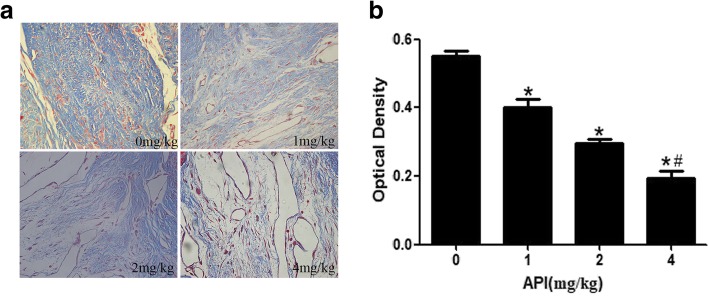
Fig. 4.
Photomicrographs of collagen density in Masson’s trichrome staining at × 400 magnification was selected from the API-treated groups and control group. As the concentration of API increased, the density of blue-stained collagen tissues decreased (a), and the value of collagen optical density also gradually decreased (b). *P < 0.05 versus the control group. #P < 0.05 compared to the other API-treated groups

