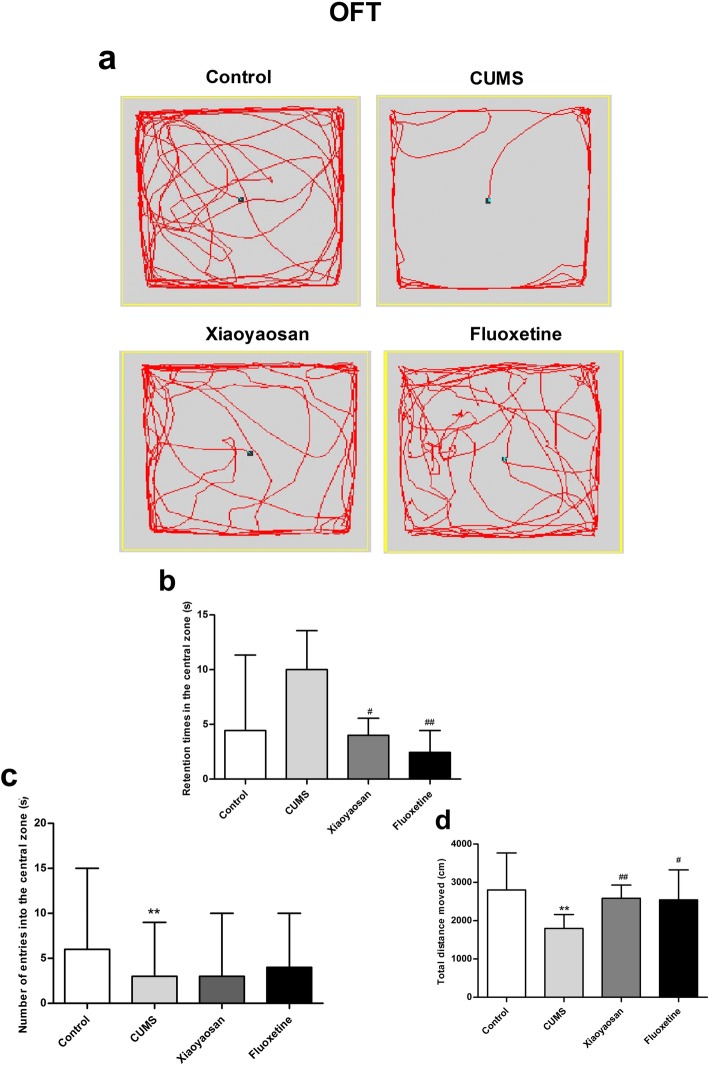
Fig. 1.
OFT test results of mice in each group. a The movement trajectory of each group of mice. b The central region residence time of mice in each group of OFTs. c The times of entry into the central area by mice in each group of OFTs. d The total distance travelled by mice in each group of OFTs. The Nemenyi method was used for data comparative analysis between groups. Values are presented as medians and interquartile ranges, (n = 15), **P < 0.01 versus the control group; #P < 0.05, ##P < 0.01 versus the CUMS group

