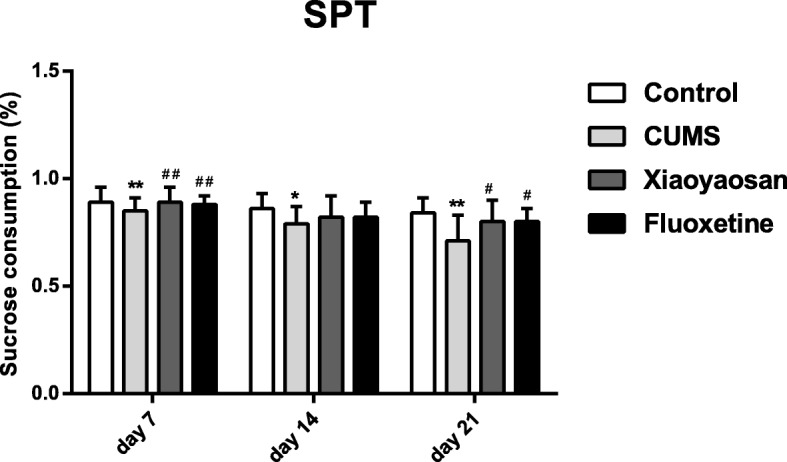
Fig. 2.

The sucrose preference of mice in each group in the SPT on the 7th, 14th, and 21st days. The Nemenyi method was used for data comparative analysis between groups. Values are presented as the medians and interquartile ranges (n = 15), **P < 0.01 versus the control group; ##P < 0.01 versus the CUMS group
