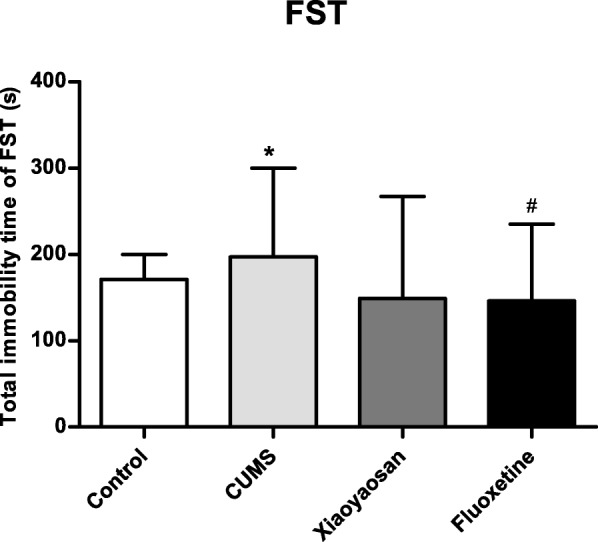
Fig. 3.

The immobility time of the mice in each group of FSTs. non-parametric test and Nemenyi method were used for data comparative analysis between groups. Values are presented as the medians and interquartile ranges (n = 15), *P < 0.05 versus the control group; #P < 0.05 or ##P < 0.01 versus the CUMS group
