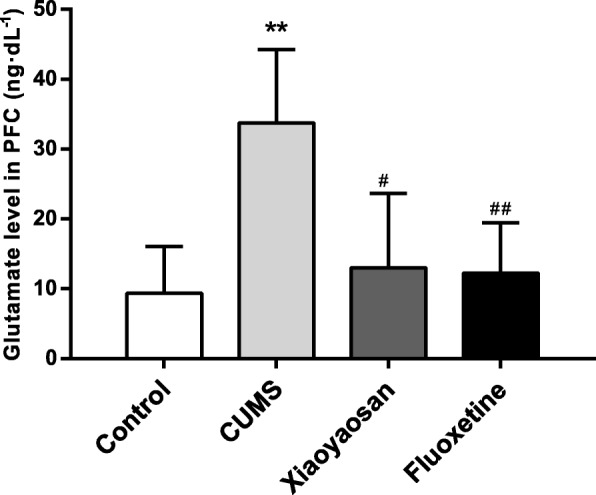
Fig. 7.

Alterations of glutamic acid levels in the PFC of mice induced by CUMS as well as XYS and Flu treatment. Sidak’s method was used for data comparative analysis between groups. Values are presented as the mean ± SEM (n = 5), **P < 0.01 versus the control group; ##P < 0.01 versus the CUMS group; #P < 0.05 versus the CUMS group
