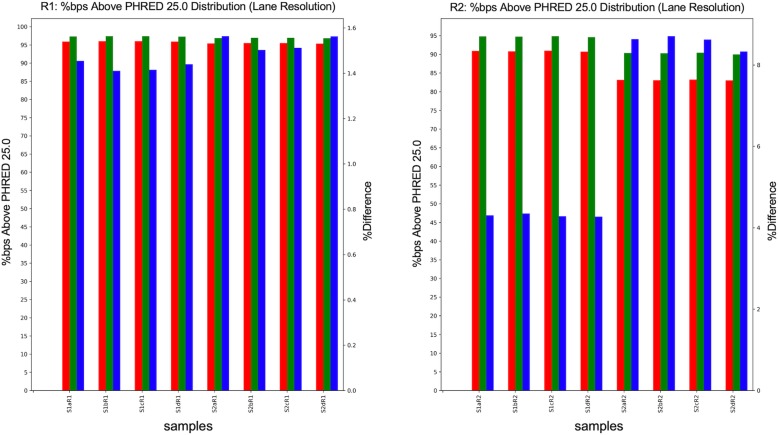
Fig. 4.
Sample FQStat output displaying high-quality bp %. The percentage of bps that exceeds the default high-quality bp score of 25 are displayed for “raw” and “trimmed” FASTQ files. The percent difference between the two datasets is shown in the secondary y-axis. The results are shown for two samples (S1 and S2), for both forward and reverse reads (R1 and R2), for all four lanes (a, b, c, and d)

