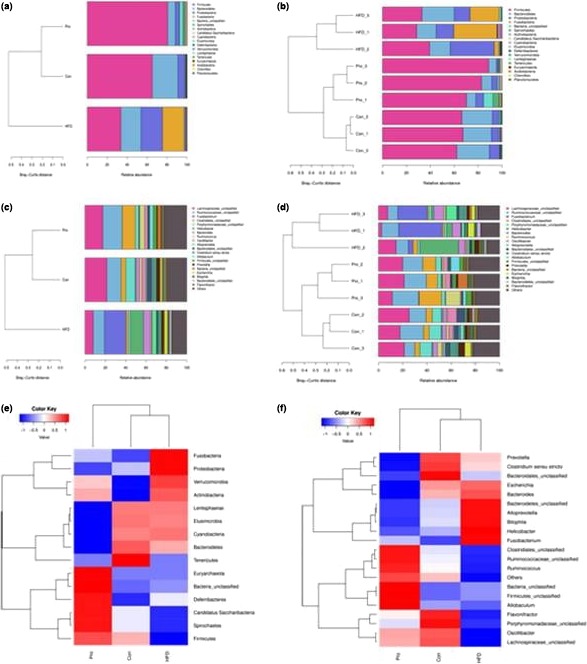
Figure 3.

The relative abundance of intestinal flora. (a and b), The top 20 species relative abundance distribution map at phylum level of each sample. (c and d), The top 20 species relative abundance distribution map at genus level of each sample. (e) Taxa heatmap at phylum level; (f) taxa heatmap at genus level. In heatmap, the gradient from blue to red reflects the change from low to high
