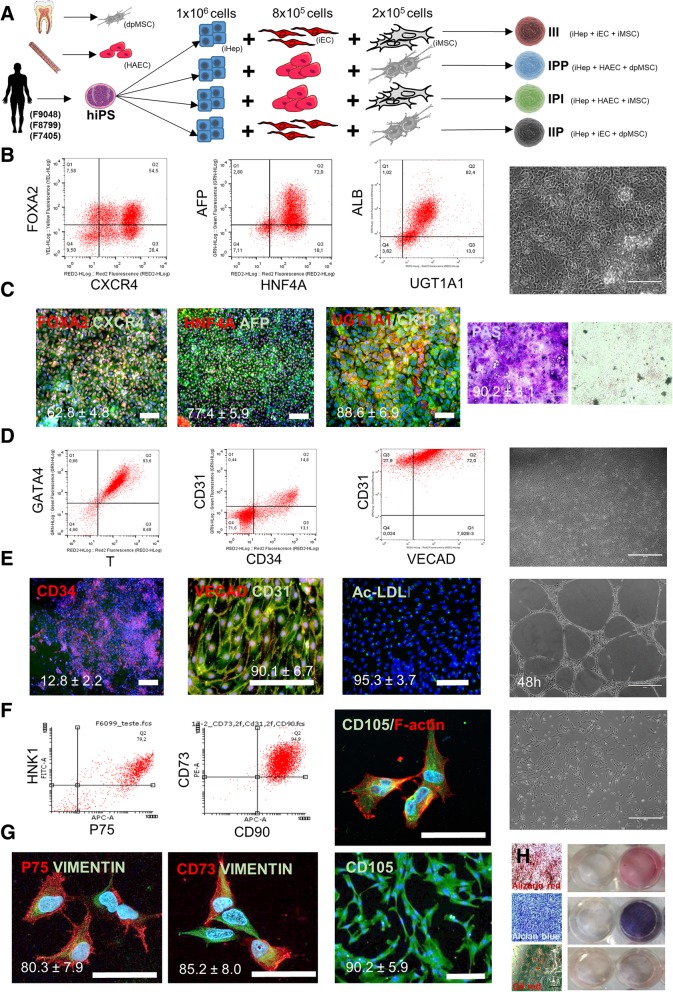
Fig. 1.
iPS cell differentiation. a Graphical summary of experimental groups and design. b Step-wise flow cytometry characterization of hepatocyte differentiation in vitro. Representative image of gated analyses for FOXA2+/CXCR4+ at day 3, AFP+/HNF4A+ at day 9, UGT1A1+/ALB+ at day 18, and phase-contrast image of cellular morphology at day 18. c IF staining for FOXA2/CXCR4 at day 3, AFP/HNF4A at day 9, and UGT1A1/ALB and PAS staining of hepatocytes at day 18 and confluent fibroblast culture PAS staining negative control (n = 3, biological replicates; data displayed as mean ± SEM, bar = 50 μm). d Step-wise flow cytometry characterization of endothelial differentiation in vitro. Representative images of gated analyses for BRACHYURY+/GATA4+ at day 2, CD34+/CD31+ at day 6, VECAD+/CD31+ at day 10, and phase-contrast image of cellular morphology at day 10. e IF staining for CD34 at day 2, VECAD/CD31 and Ac-LDL uptake at day 10, and angiogenesis assay at day 12 (n = 3, biological replicates; data displayed as mean ± SEM, bar = 50 μm). f Step-wise flow cytometry characterization of iNCC-MSC differentiation in vitro. Representative image of gated analyses for P75+/HNK1+ at day 18 and CD73+/CD90+ and IF staining for CD105/F-Actin and phase-contrast image at day 28. g IF staining for P75/VIMENTIN at day 18, CD73/VIMENTIN and CD105 at day 28, and representative images for MSC differentiation assay after 28 days of induction and stained for Alizarin Red, Alcian Blue, and Oil red (n = 3, biological replicates; data displayed as mean ± SEM, bar = 50 μm)

