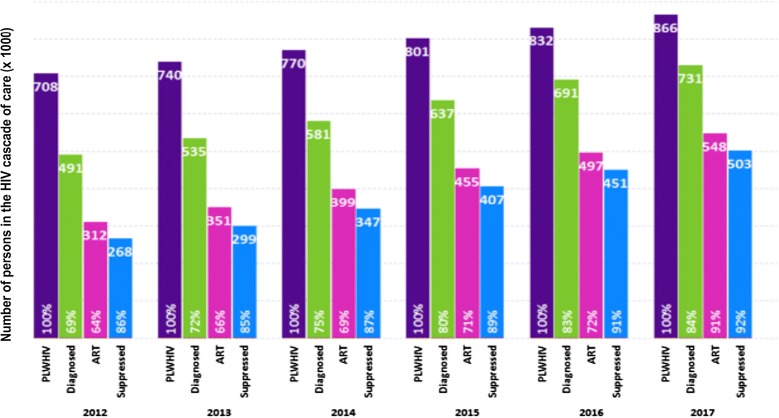
Fig. 1.
Brazil’s continuum of care cascade, 2012–2017. People leaving with HIV (PLWHIV) groups are represented by vertical bars of different colors: total persons in purple; persons diagnosed in green; persons on ART in pink; treated persons with suppressed HIV viremia in blue. Numbers at the top of each bar are in thousands. Percentages at the bottom of each bar are relative to the total number of the previous category

