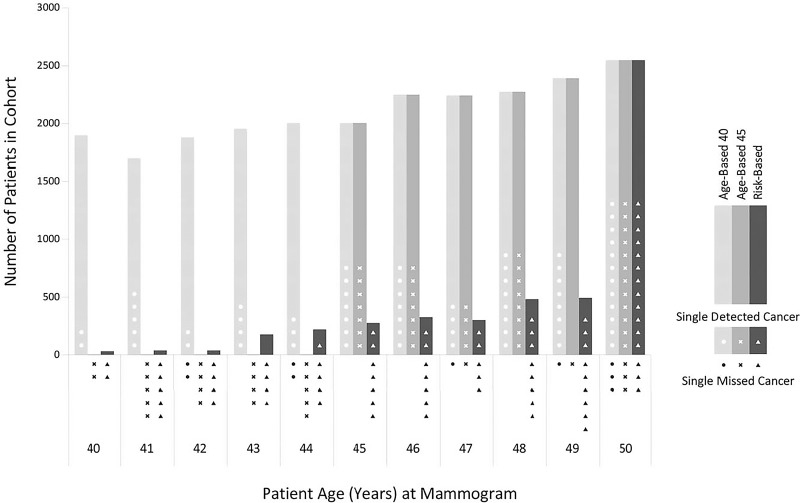
Figure 2:
Bar graph shows the numbers of mammograms in usual care (screening at ages 40–49 years) (light gray bar) and for the hypothetical screening strategies of age-based (≥45 years) screening (medium gray bar) and risk-based screening (dark gray bar). The shapes within or below the respective bars represent screening-detectable breast cancers either detected at mammography (white shapes) or not detected at mammography (black shapes) according to screening strategy.

