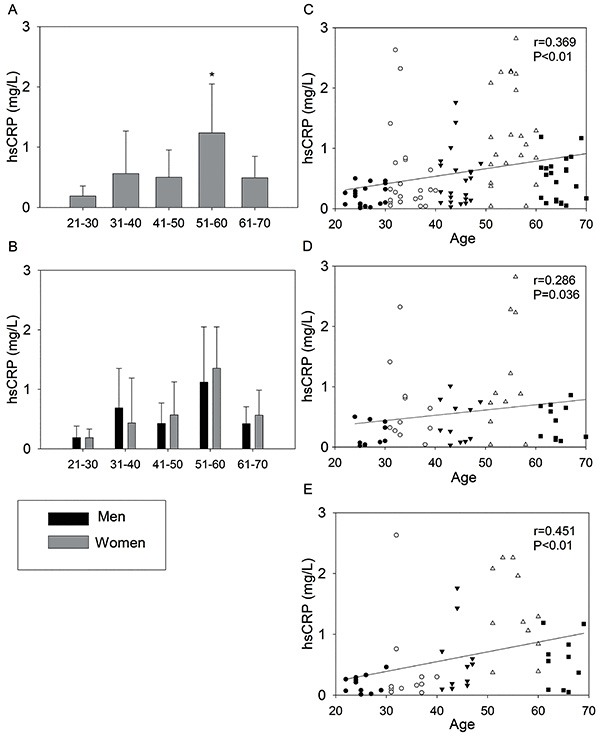
Figure 1. High sensitivity C-reactive protein (hsCRP) of the 110 volunteers (A) and divided by gender (B). Data are reported as means±SD. *P<0.05 compared to all the other age groups (two-way analysis of variance). hsCRP as function of age of the 110 volunteers (C), men (D), and women (E). •: 21–30; ○: 31–40; ▾: 41–50; Δ: 51–60; ▪: 61–70. Spearman correlation coefficient (r).