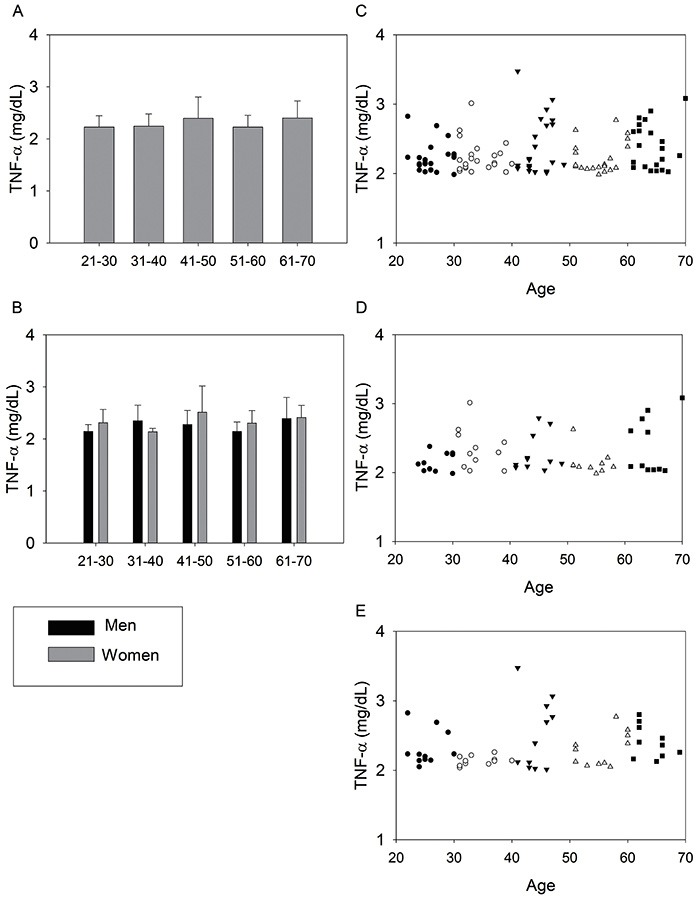
Figure 2. Tumor necrosis factor α (TNF-α) of the studied age groups of the 110 volunteers (A) and divided by gender, (B). Data are reported as means±SD. TNF-α as function of age of the 110 volunteers (C), men (D), and women (E). •: 21–30; ○: 31–40; ▾: 41–50; Δ: 51–60; ▪: 61–70.