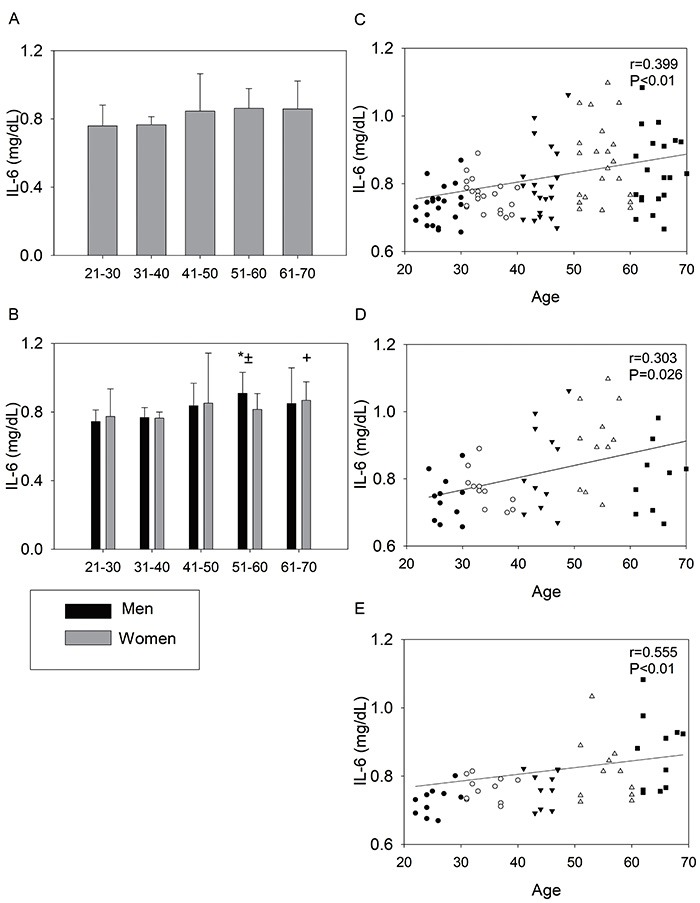
Figure 3. Interleukin 6 (IL-6) of the 110 volunteers (A) and divided by gender (B). Men: *P<0.05 compared to 21–30, 31–40, and 61–70; Women: +P<0.05 compared to 21–30 and 31–40; ±statistical difference between men and women in 51-60 (two-way analysis of variance). Right panels: hsCRP as a function of age of the 110 volunteers (C), men (D), and women (E). •: G21–30; ○: G31–40; ▾: G41–50; Δ: G51–60; ▪: G61–70. Spearman correlation coefficient (r) and P<0.05.