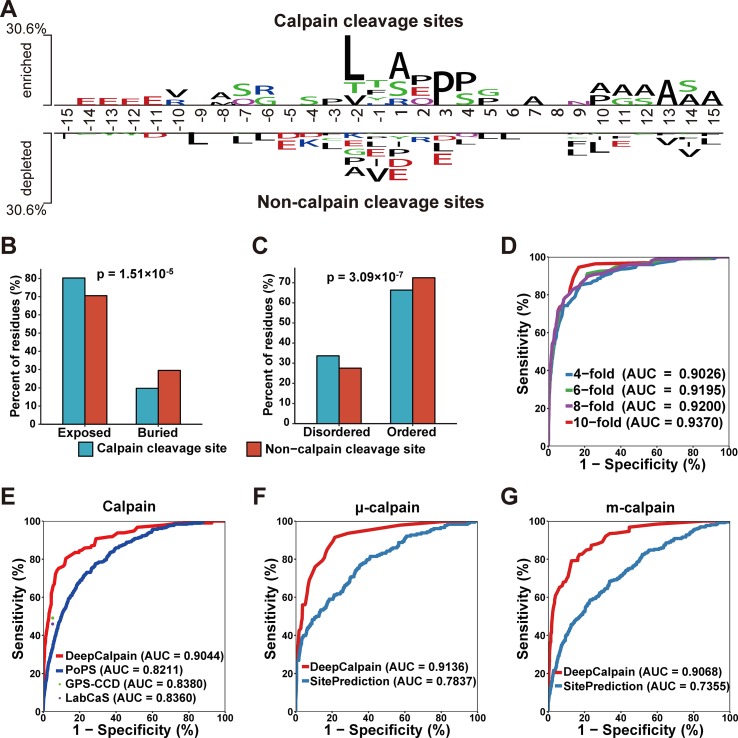
Figure 2.
(A) The preferences for the amino acids around the calpain cleavage sites and non-calpain cleavage sites. (B–C) Comparison of the surface accessibility (B) and disorder information between calpain cleavage sites and non-calpain cleavage sites. (D) The 4-, 6-, 8-, and 10-fold cross-validations results for calpain. (E–G) Comparison of the models of calpain (E), µ-calpain (F), and m-calpain (G) with the existing tools, and the dots were the Sn and Sp values adopted from the related literatures.

