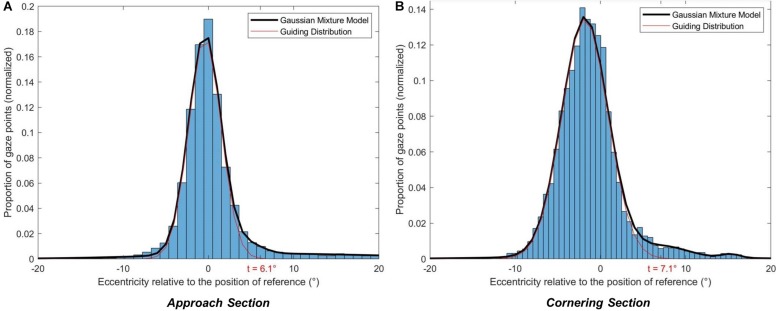
FIGURE 4.
Threshold calculation. For each section (A: Approach, B: Cornering), the gaze distribution in the active driving condition was modeled with a Gaussian mixture model of 4 Gaussians. The main Gaussian (GF Gaussian) allows operationally defining the guiding fixations. The threshold (t) was set so that 99.95% of guiding fixations were below the threshold value.

