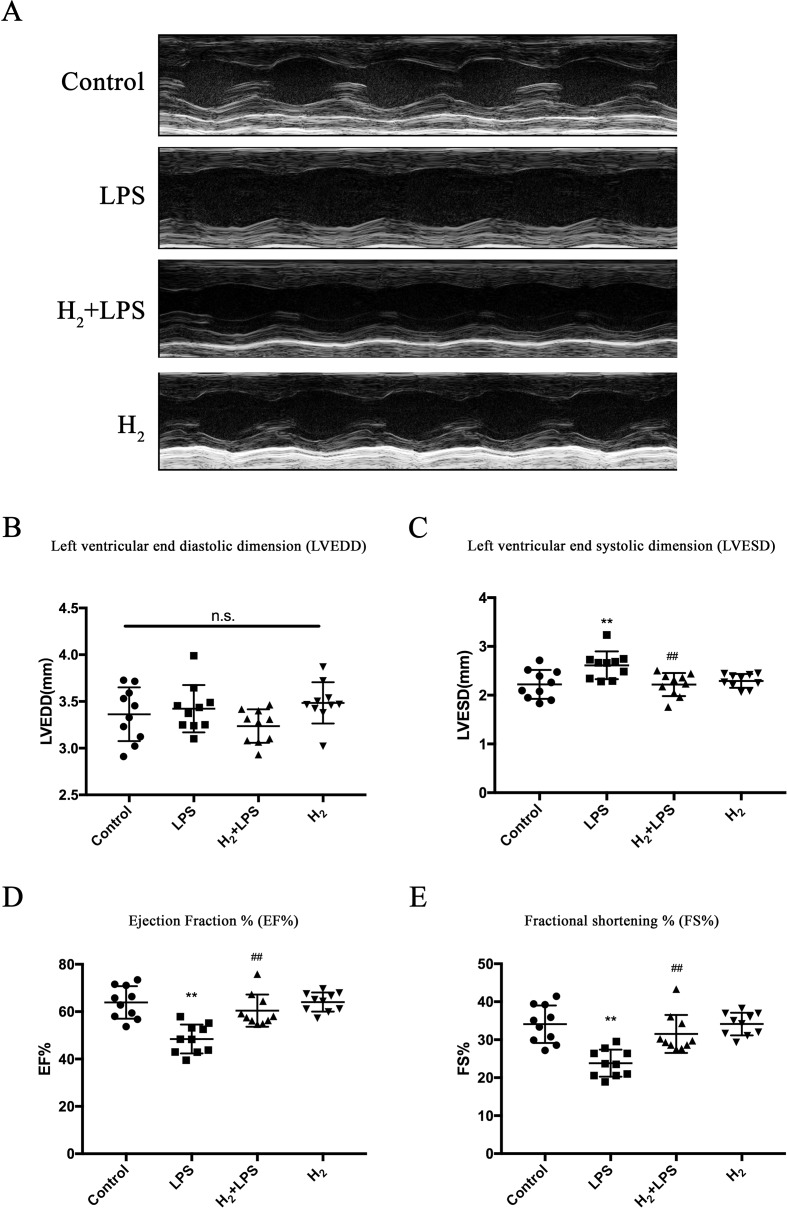
Figure 1.
H2 protects against lipopolysaccharide (LPS)-induced cardiac dysfunction. (A) Representative M-mode echocardiographic images at 6 h after LPS injection. (B–E) Quantification of left ventricular end-diastolic diameter (LVEDD), left ventricular end-systolic diameter (LVESD), EF%, and FS% by echocardiography at 6 h after LPS injection (n = 10). **P < 0.01 vs Control, ## P < 0.01 vs LPS.

