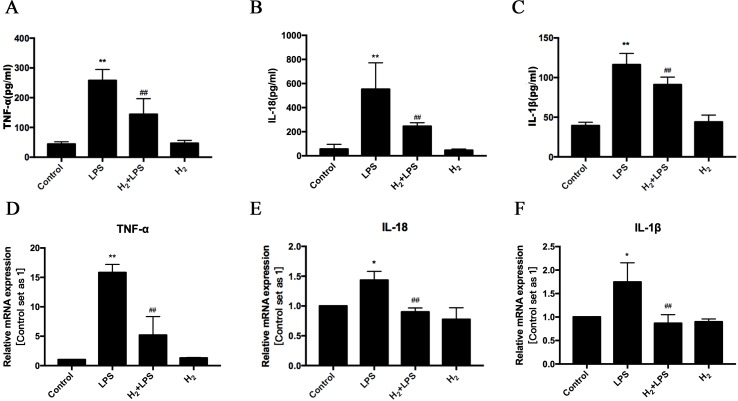
Figure 3.
The effects of H2 on LPS-induced inflammatory cytokines expression. (A–C) The concentration of TNFα, IL-18, and IL-1β in serum (n = 5–8). **p < 0.01 vs Control, # p < 0.05 vs LPS, ## p < 0.01 vs LPS. (D–F) Quantification of the mRNA levels of TNFα, IL-18, and IL-1β in H9c2 cardiomyocytes, GAPDH was used as a loading control (n = 3). *p < 0.05 vs Control, **p < 0.01 vs Control, ## p < 0.01 vs LPS. n.s. means “no significance.”

