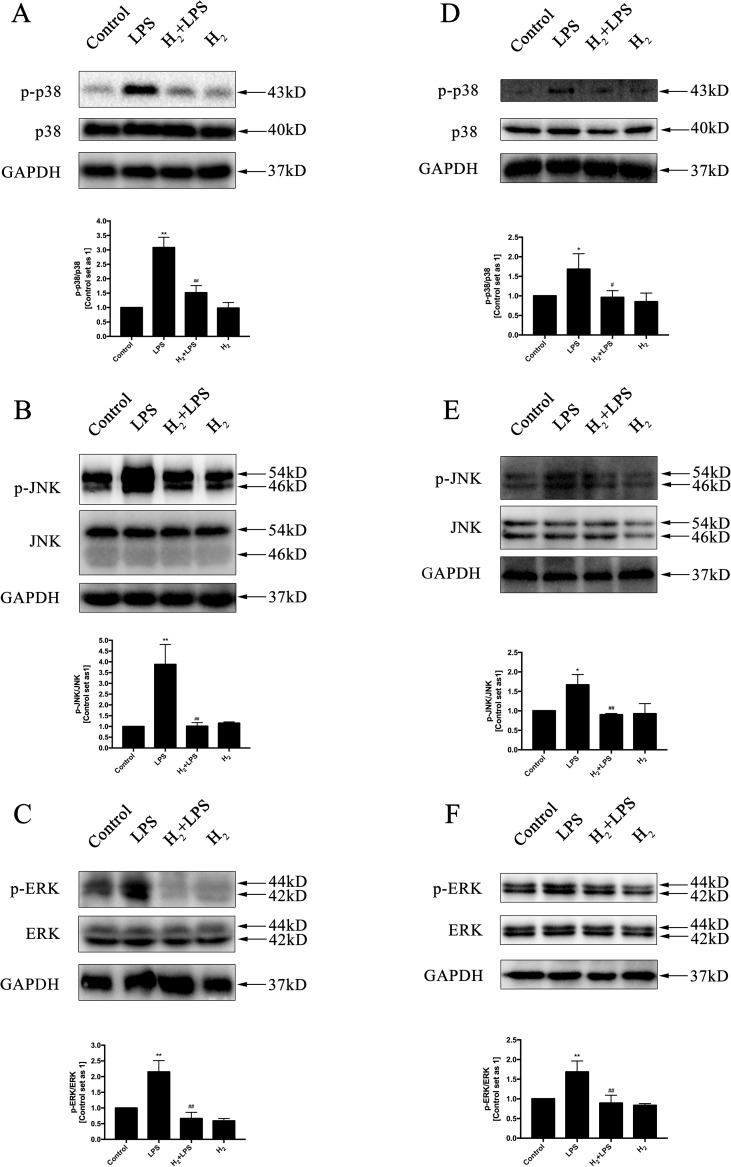
Figure 4.
The effects of H2 on LPS-mediated MAPK signaling activation. Representative Western blot and quantification of p38 phosphorylation (A and D), JNK phosphorylation (B and E), and ERK1/2 phosphorylation (C and F) to their total protein expressions (n = 3). *p < 0.05 vs Control, **p < 0.01 vs Control, # p < 0.05 vs LPS, ## p < 0.01 vs LPS.

