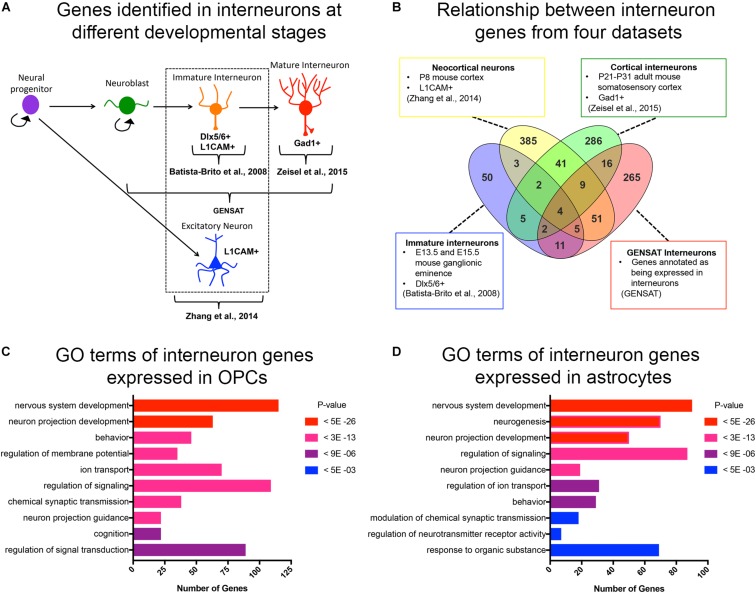
FIGURE 1.
Curated list of interneuron genes. (A) Diagram illustrating the stages of interneuron development and the sets of interneuron genes used. Markers used to identify interneuron populations are shown. (B) Venn diagram displaying the number of genes obtained from each source and the degree of overlap. A total of 500 genes from P8 neocortical neurons, 82 genes from immature neurons from embryos, 365 genes from cortical interneurons from juvenile mice, and 372 genes from GENSAT annotated interneurons. (C,D) Bar graphs of the top 10 significant gene ontology (GO) terms (y-axis) of interneuron genes expressed in OPCs (C) and astrocytes (D). The number of genes in each GO category is shown on the x-axis. GO categories are ordered by p-values. Red represents the most significant GO terms while blue represents the least significant.

