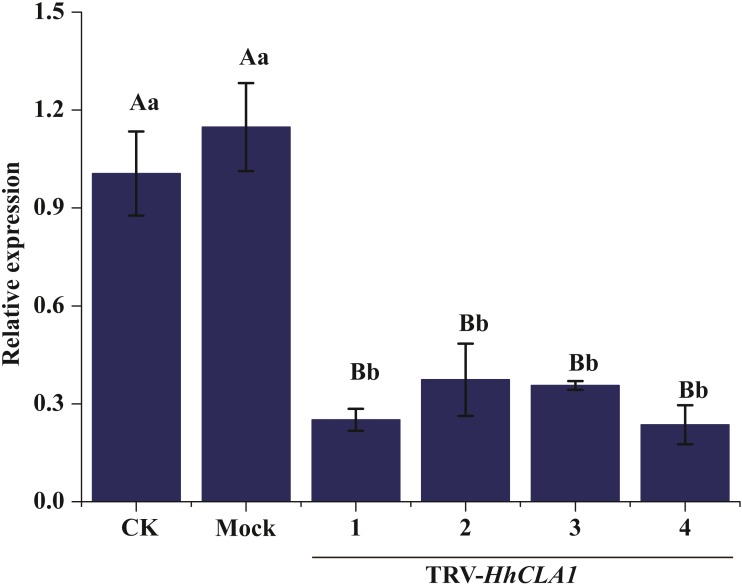
Figure 4. Relative expression levels of HhCLA1 transcripts in control (CK), empty vector-infected (Mock) and pTRV-HhCLA1-infected plants (pTRV2-HhCLA1).
Error bars represent standard errors, and any two samples with a common capital letter are not significantly different at the P < 0.01 level, as with a same small letter are not significantly different at the P < 0.05 level.

