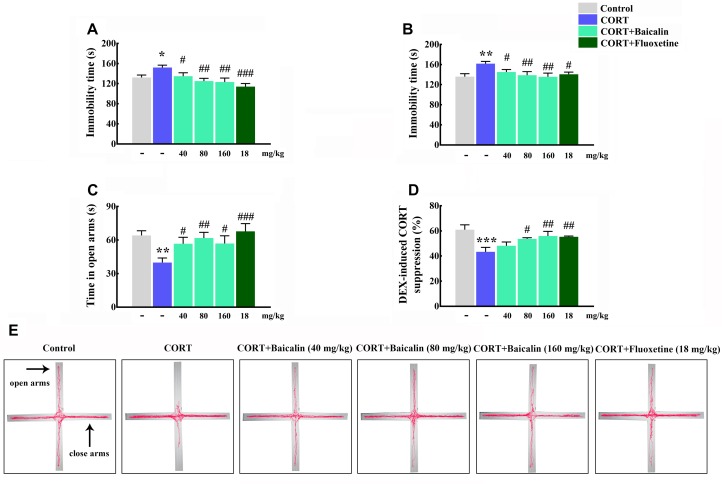
FIGURE 2.
Effects of baicalin on tail suspension test (A), forced swimming test (B), elevated plus maze (C), and DEX-induced corticosterone suppression (D) in CORT-induced mice. Representative movement tracks in the elevated plus maze are showed in (E). Data are expressed as means ± SEM (n = 8–12 mice/group). *P < 0.05, ∗∗P < 0.01, and ∗∗∗P < 0.001 vs. control. #P < 0.05, ##P < 0.01, and ###P < 0.001 vs. CORT model.

