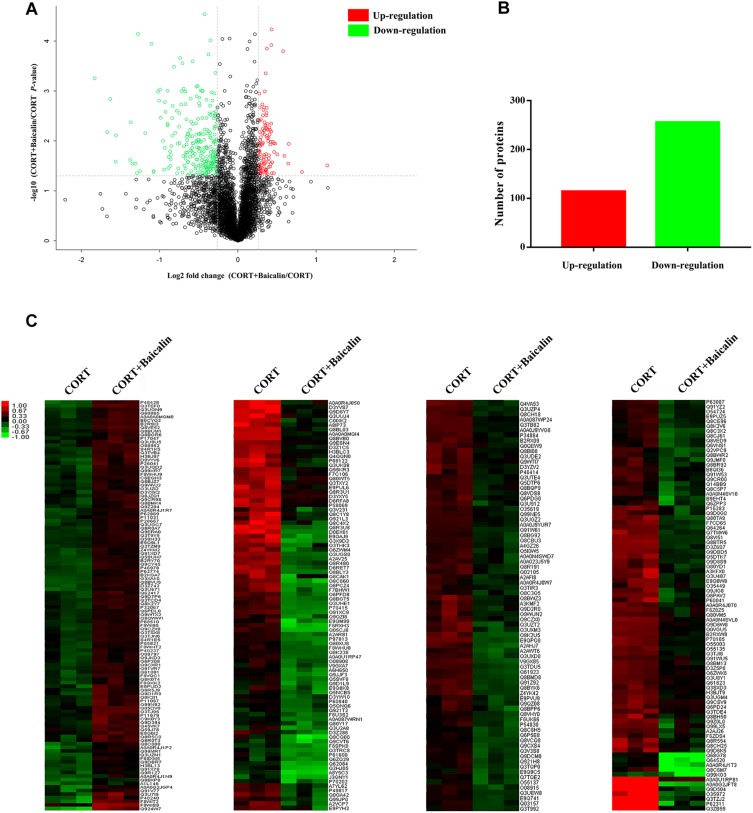
FIGURE 3.
Volcano plot (A), quantitative analysis (B), and hierarchical clustering (C) of differentially expressed proteins after baicalin treatment in CORT-induced mice. The log2-transformed value of cluster analysis was showed by red-green color scale (C). Red meant high expression and green meant low expression.

