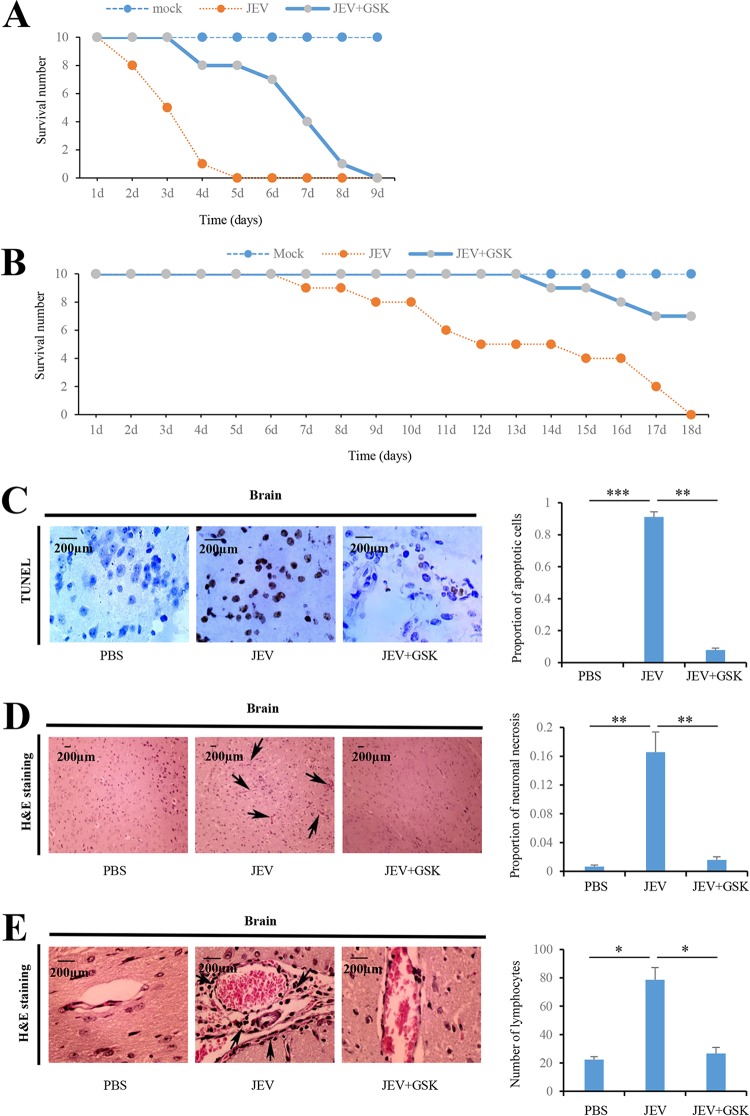
FIG 6.
JEV-activated PERK is involved in JEV-induced Japanese encephalitis in mice. (A) Ten mice inoculated intracranially with PBS were used as mock-infected controls. Ten mice were inoculated intracranially with JEV at a dose of 104 PFU per mice. Ten mice were inoculated intracranially with JEV at a dose of 104 PFU per mice, followed by intracranial injection with GSK2606414 (800 μg/kg [body weight]) 3 h after infection. The survival of mice in each group was monitored for 9 days after JEV inoculation. Data were collected and are shown as Kaplan-Meier survival curves (n = 10 mice). (B) Ten mice inoculated subcutaneously with PBS were used as mock-infected controls. Ten mice were inoculated subcutaneously with JEV at a dose of 102 PFU per mice. Ten mice were inoculated subcutaneously with JEV at a dose of 102 PFU per mice, followed by intracranial injection with GSK2606414 (800 μg/kg [body weight]) 3 h after infection. The survival of mice in each group was monitored for 18 days after JEV inoculation. Data were collected and are shown as Kaplan-Meier survival curves (n = 10 mice). (C to E) Mice were inoculated intracranially with PBS or JEV (104 PFU per mice), followed by intracranially injection with GSK2606414 (800 μg/kg [body weight]) as indicated. Brain tissues were collected 3 days after infection. The apoptotic cells in the brain sections were detected using the TUNEL assay kit (C). The histopathological changes of the mouse brain were observed by H&E staining (D and E). Meningitis (D) and perivascular cuffing (E) that appeared in the JEV-infected groups are indicated by arrows. Left panels (C, D, and E) show representative images; right panels (C, D, and E) show quantitation data. Error bars indicate the SD of the mean (n = 3). Scale bars, 200 μm. *, P < 0.05; **, P < 0.01; ***, P < 0.001.

