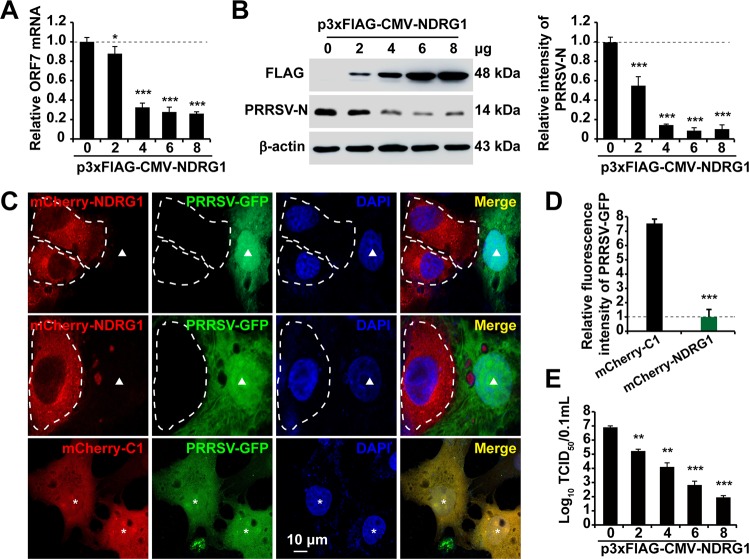
FIG 4.
Overexpression of NDRG1 reduces PRRSV replication. (A) MARC-145 cells were transfected with different concentrations of a plasmid encoding FLAG-NDRG1 or with p3×Flag-CMV-10 for 24 h and then infected with PRRSV BJ-4 (MOI = 10) for 36 h. The mRNA levels of PRRSV ORF7 were detected by RT-qPCR. Values were normalized to the β-actin (ACTB) mRNA levels. *, P < 0.05; ***, P < 0.0001. (B) Immunoblot analysis of PRRSV-N expression in cells from panel A. Antibodies used are indicated on the left. β-Actin was used as the loading control. Semiquantitative densitometric analyses of FLAG-NDRG1 and PRRSV-N were performed using ImageJ software. The protein content was normalized to the corresponding β-actin level. ***, P < 0.0001 (by one-way ANOVA). (C) MARC-145 cells were transfected with plasmid mCherry-NDRG1 or mCherry-C1 for 24 h and then infected with PRRSV-GFP at an MOI of 10 for 36 h. Cells were fixed and stained with DAPI (4′,6-diamidino-2-phenylindole), and their fluorescence was detected by fluorescence microscopy. White dotted lines highlight NDRG1-transfected cells, arrowheads indicate PRRSV-GFP-infected cells transfected with mCherry-NDRG1, and asterisks indicate PRRSV-GFP-infected cells transfected with pmCherry-C1. (D) GFP fluorescence intensities were quantified in cells transfected with both pmCherry-C1 and pmCherry-NDRG1 (n = 40) using ImageJ. Data are means ± standard errors of the means. ***, P < 0.0001 (by an unpaired two-tailed t test). (E) MARC-145 cells were transfected with different concentrations of a plasmid encoding FLAG-NDRG1 or with p3×Flag-CMV-10 for 24 h and then infected with PRRSV BJ-4 (MOI = 10) for 36 h. Virus was harvested with three freeze-thaw cycles, and the viral titer was determined by a TCID50 assay. **, P < 0.01; ***, P < 0.0001 (by one-way ANOVA).

