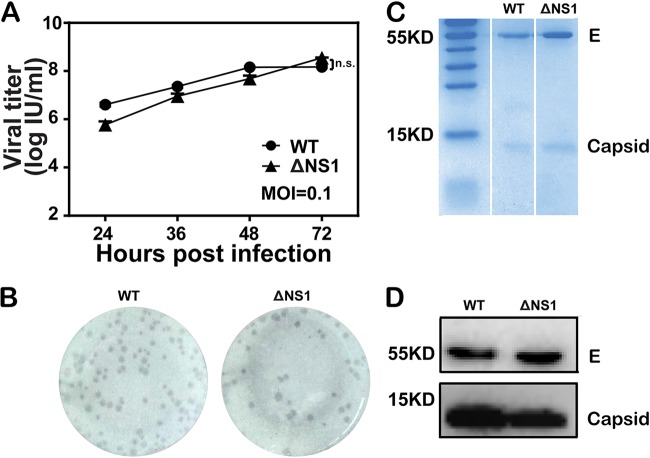
FIG 2.
Characterization of WNV-ΔNS1. (A) Comparison of growth kinetics between WT WNV and WNV-ΔNS1 virus in VeroNS1 cells. VeroNS1 cells were infected with either WT WNV or WNV-ΔNS1 virus at an MOI of 0.1. The supernatants were harvested at the indicated time points, and viral titers were determined as described above. Data represent the mean ± standard deviation of triplicate measurements in a representative experiment. n.s., no statistical difference. (B) Comparison of immunostained foci between WT WNV and WNV-ΔNS1 virus in VeroNS1 cells. The plaque morphology of WNV-ΔNS1 was analyzed by a standard immunostaining-based focus-forming assay and compared with that of WT virus. (C) Coomassie brilliant blue staining analysis of purified WT WNV and WNV-ΔNS1 virions. Following concentration and purification through PEG8000 precipitation and ultracentrifugation, equal amounts of purified WT and ΔNS1 virions were loaded onto a SDS-polyacrylamide gel, and protein bands were visualized by Coomassie brilliant blue staining. The bands corresponding to E and capsid proteins are indicated. (D) Western blotting analysis of purified WT WNV and WNV-ΔNS1 virions. The virus antigens described above were analyzed by Western blotting with an anti-E monoclonal antibody and anti-C polyclonal antibody.

