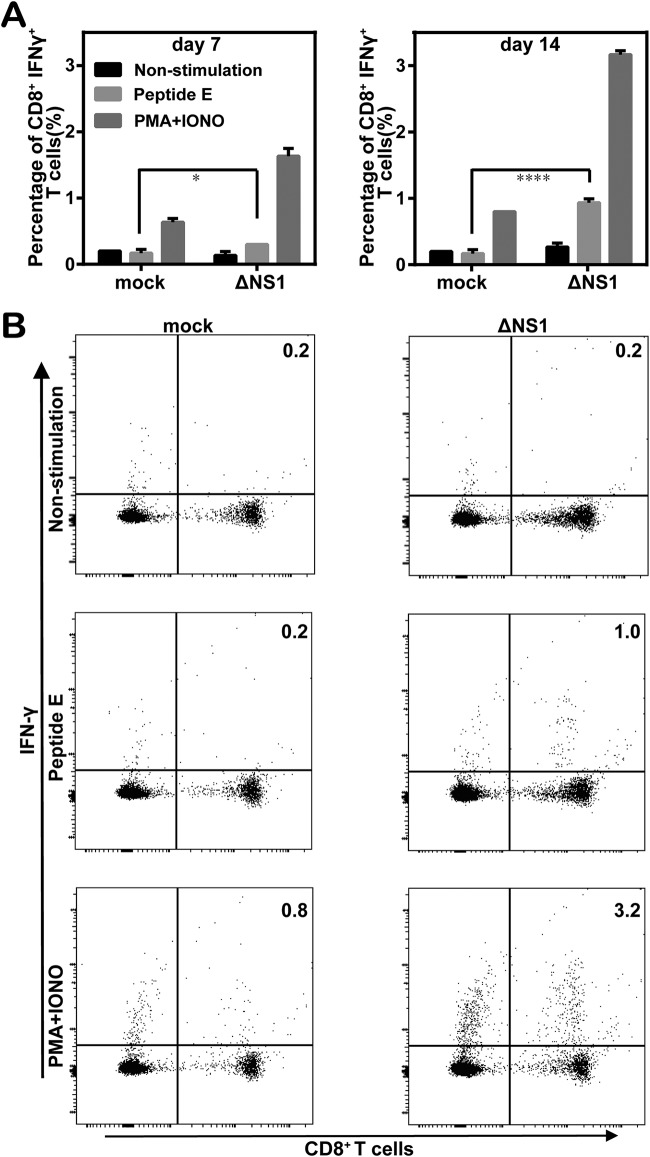
FIG 7.
CD8+ T cell responses in WNV-ΔNS1-vaccinated C57BL/6 mice. (A) Summary of the percentages of IFN-γ+ CD8+ T cells in the total number of CD8+ T cells without stimulation (non-stimulation) or with stimulation with WNV peptide (peptide E) or PMA and IONO at 7 and 14 days after booster immunization. Mock-vaccinated mice were used as a negative control. Data represent the mean ± standard deviation of 5 mice at each time point in each group. The asterisks denote statistical differences between the indicated groups. *, P < 0.05; ****, P < 0.0001. (B) Representative flow cytometry contour plots of IFN-γ+ CD8+ T cells on day 14 after booster immunization. The CD8+ T cells were gated, and the percentages of IFN-γ+ CD8+ cells are indicated in the top right corners.

