FIG 1.
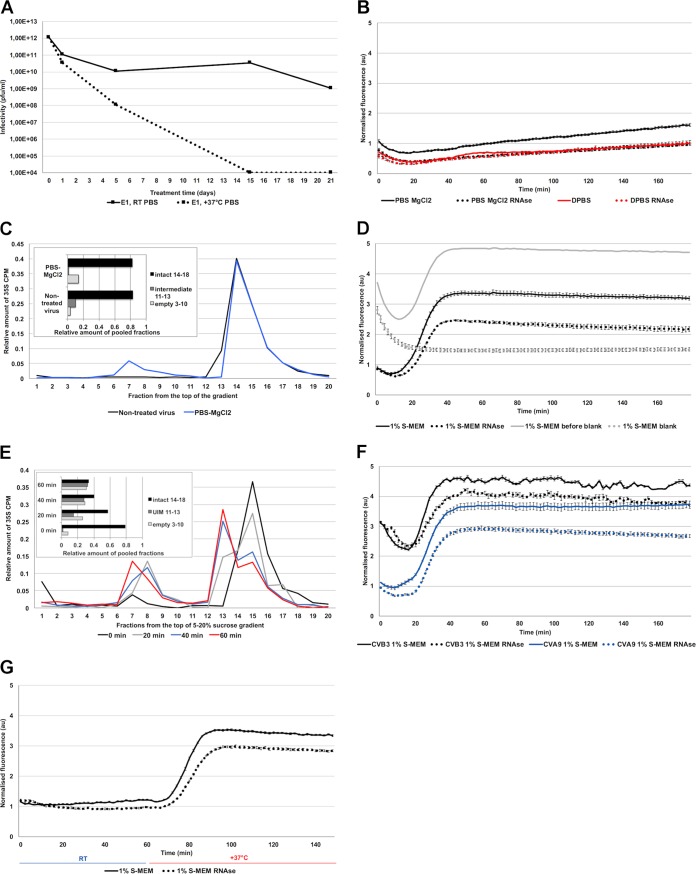
Echovirus 1 stability. (A) Infectivity of E1 after 1, 5, 15, or 21 days in PBS at 37°C or room temperature. (B) Fluorescence measurement of SYBR green II (SGII) dye in the presence of 1 μg E1 in PBS-MgCl2 and DPBS with or without RNase during 3 h at 37°C. (C) Sucrose gradient (5% to 20%) separation of 35S-labeled E1 when treated for 1 h at 37 °C in PBS-MgCl2 versus nontreated virus at 4°C in PBS-MgCl2. The amounts of different virus populations are shown in the inset. (D) Fluorescence measurement of SGII dye in the presence of 1 μg E1 in 1% S-MEM at 37°C. In gray, as an example, results of the same virus measurements before and subtracting the blank measurements. In the presented results of 1% S-MEM, and in all of the presented fluorescence results in this paper, the blank, which contains all other factors except the virus (gray dotted lines), is subtracted from the measurement with virus (gray solid lines). (E) Sucrose gradient (5% to 20%) separation of 35S-labeled E1 when treated for 0 to 60 min at 37°C in 1% S-MEM. The amounts of different virus populations are shown in the inset. (F) Fluorescence measurements of SGII dye in the presence of 1 μg of CVB3 or CVA9 in 1% MEM at 37°C during 3 h. (G) Fluorescence measurements of SGII dye in the presence of 1 μg E1 in 1% S-MEM at room temperature (23°C) for 60 min after which the multilabel reader heater was turned to 37°C for 90 min. The transition from room temperature to 37°C lasted about 12 min. In all of the fluorescence measurements, in this and other figures, the y axes are normalized to the final fluorescence values of the control DPBS treatment (panel B, red solid line). Treatments in each buffer with and without RNase are marked with the same colors but with dotted and solid lines, respectively. All fluorescence measurements are averages from a minimum of five measurements and the presented error bars are ± standard errors of the means.

