FIG 4.
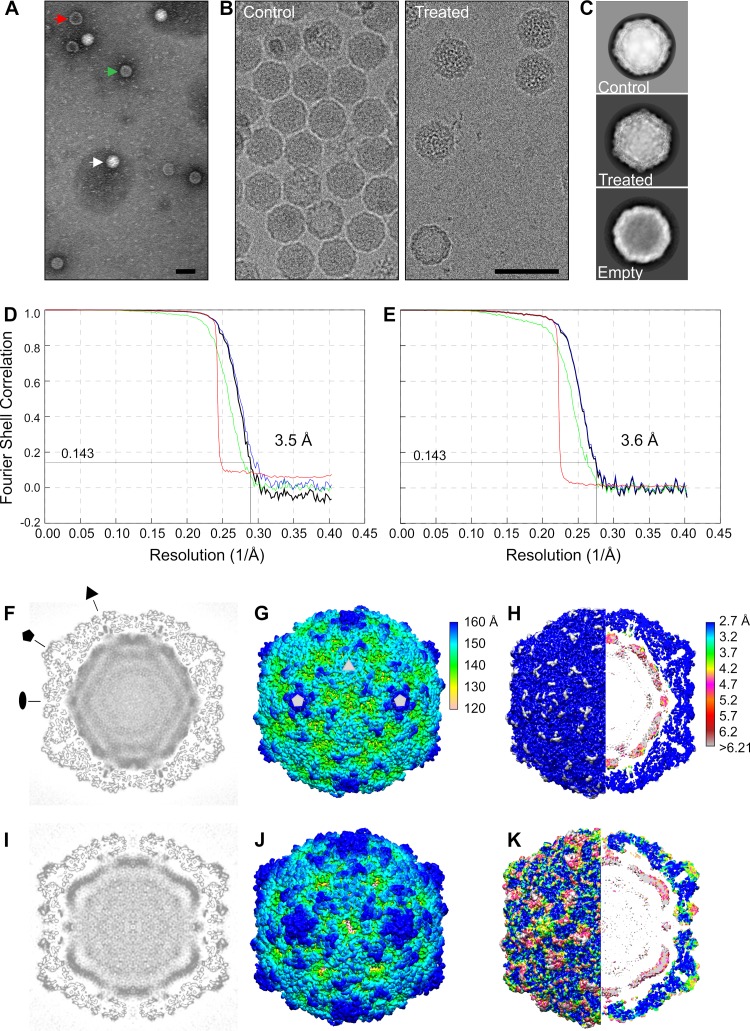
Electron microscopy and cryoEM reconstructions of E1 intact and treated virions. (A) Negative stain of E1 after 1 h treatment at 37°C with 29 mM NaCl, 28 mM K, 0.145 mM MgCl2, 0.0093% faf-BSA. (B) Cryo-electron micrographs of nontreated (control) E1 and E1 after similar treatment to that for panel A. The white arrow indicates an intact virion, the red arrow an empty particle, and the green arrow an intermediate particle. Bars, 50 nm. (C) Example of 2D class averages showing intact (control, n = 16,298), treated (n = 2,015), and empty (n = 212) class averages, where n is the number of particles contributing to the averages shown. Box size is 496 Å (D) Fourier shell correlation curves for the control E1 reconstruction, giving a resolution of 3.5 Å with a cutoff of 0.143. (E) Fourier shell correlation curves for the treated particle reconstruction giving a resolution of 3.6 Å with a cutoff of 0.143. Corrected (black), unmasked (green), masked (blue), and phase randomized masked (red) maps (71). (F) Control E1 reconstruction central plane. Pentagon, triangle, and oval indicate 5-fold, 3-fold, and 2-fold symmetry axes, respectively. (G) Radially colored isosurface representation of the control E1 reconstruction viewed down a 2-fold axis of symmetry at 1.5 standard deviations (SDs) above the mean. Pentagons and triangle mark 5-fold and 3-fold axes, respectively. Two-fold axis is in the middle between the two marked 5-fold axes. (H) Control E1 colored by local resolution (79). (I) Treated particle reconstruction central plane. (J) Isosurface representation of treated particle viewed down a 2-fold axis of symmetry at 1.5 SDs above the mean. Radially colored according to the color key in panel G. (K) Treated particle colored by local resolution. Resolution colored according to the color key in panel H.

