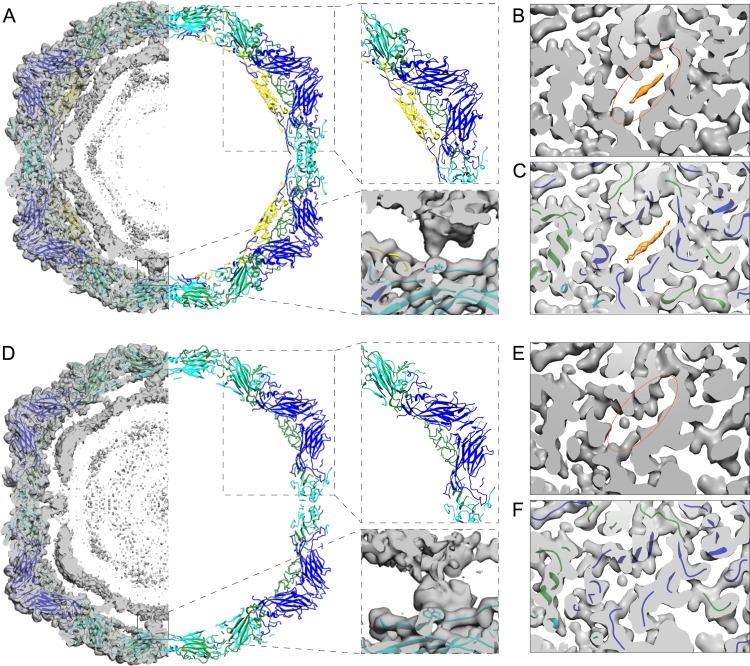
FIG 5.
Comparison of reconstructions and atomic models of control and treated E1 virions. (A) Slab of the virion atomic model (1EV1) (48) shown in ribbon, fitted into the control E1 density (left). Most of the capsid density is accounted for by the atomic model, but the inner density from the RNA is not. The upper right inset highlights the structure of one pentamer with VP4. The lower right inset highlights the interaction of the RNA and VP2 Trp 38 next to the 2-fold axis. (B) Section of control E1 reconstruction revealing the pocket and the lipid factor. (C) The same as in panel B with the atomic model fitted. (D) Slab of the treated atomic model (wwPDB deposition ID 6O06) shown in ribbon, fitted into the treated particle density (left). Most of the capsid density is accounted for by the atomic model, but the inner density from the RNA is not. The position of the RNA has moved radially outwards as the capsid expanded, maintaining the 2-fold connections. The upper right inset highlights the structure of one pentamer without VP4 modeled as there was no apparent density for it. The lower right inset highlights the interaction of the RNA and VP2 Trp 38 next to the 2-fold axis. (E) Section of treated particle reconstruction revealing the collapsed pocket and no evident density for the lipid factor. (F) The same as in panel E with the atomic model fitted. For all panels, EM density shown in transparent gray, lipid factor EM density in orange, VP1 (blue ribbon), VP2 (cyan ribbon), VP3 (green ribbon), VP4 (yellow ribbon), lipid factor (orange stick). In panels B and E, orange ovals indicate the corresponding positions of the pocket.

