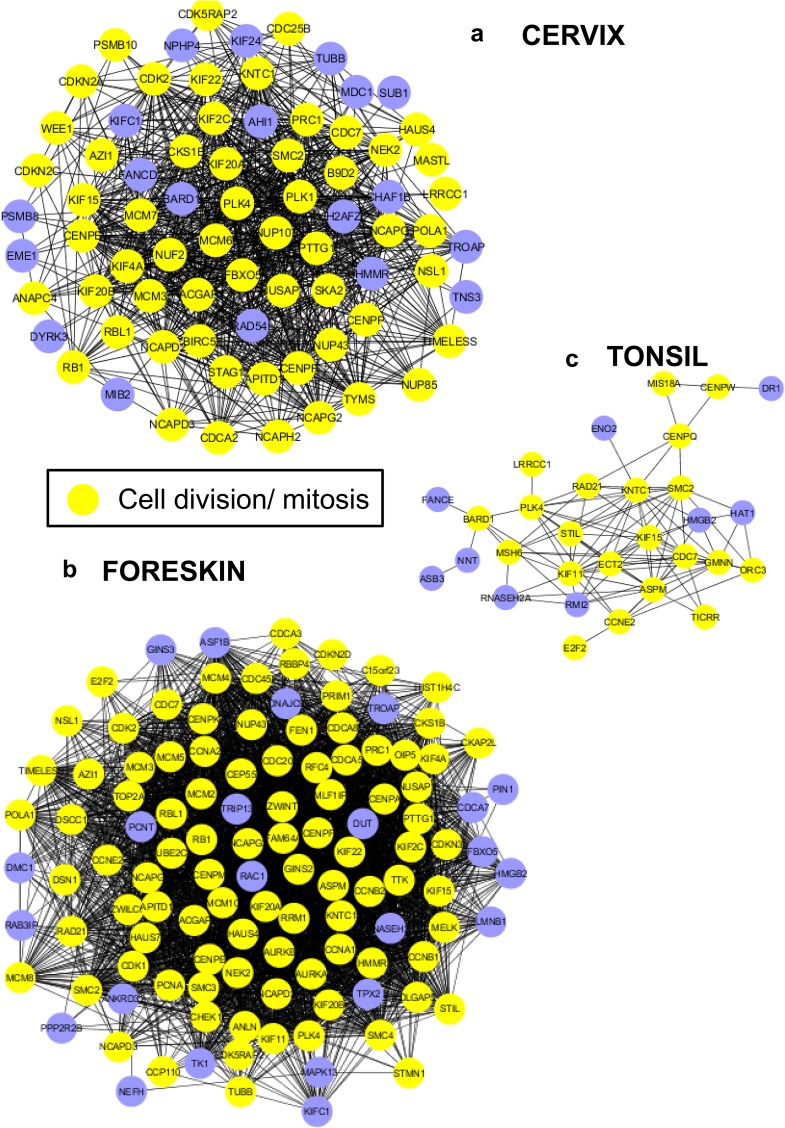
FIG 5.
The protein interaction networks of upregulated genes depict dense interconnectivity and high representation of proteins related to mitosis and cell division in HPV16 cervical (a), foreskin (b), and tonsil (c) epithelium. The CLUSTER function (STRING database) was used to identify the most relevant protein interactions among the upregulated targets. Cytoscape software (3.6.0) was used to construct the networks, using yFiles hierarchic layout.

