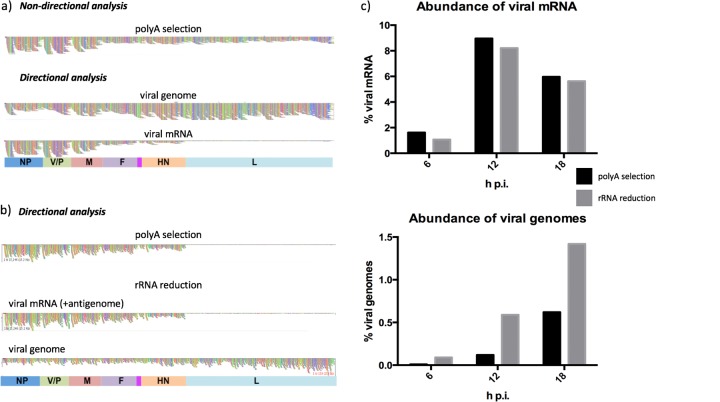
FIG 1.
Optimization of a workflow to study PIV5-W3 transcription and replication by nondirectional analysis of HTS data followed by directional analysis to distinguish mRNA/antigenome reads from genome reads. In panels a and b, colored boxes indicate approximate gene positions and contain the names of the genes. The individual colored vertical bars represent the coverage depth (number of reads) at each nucleotide in the reference sequence. (a) BWA alignments of the PIV5-W3 transcriptome in HSFs at 18 h p.i. analyzed using poly(A)-selected RNA and visualized in Tablet. (b and c) Comparison of mRNA/antigenome and genome RNA abundance relative to total RNA after poly(A) selection or rRNA reduction of total cell RNA. RNA was extracted from PIV5-W3-infected A549 cells at 6, 12, and 18 h p.i., and the reads were subjected to directional analysis. (b) BWA alignments for mRNA/antigenome and genome reads at 18 h p.i. visualized in Tablet. (c) Abundance of mRNA/antigenome and genome reads at 6, 12, and 18 h p.i.

