Figure 1.
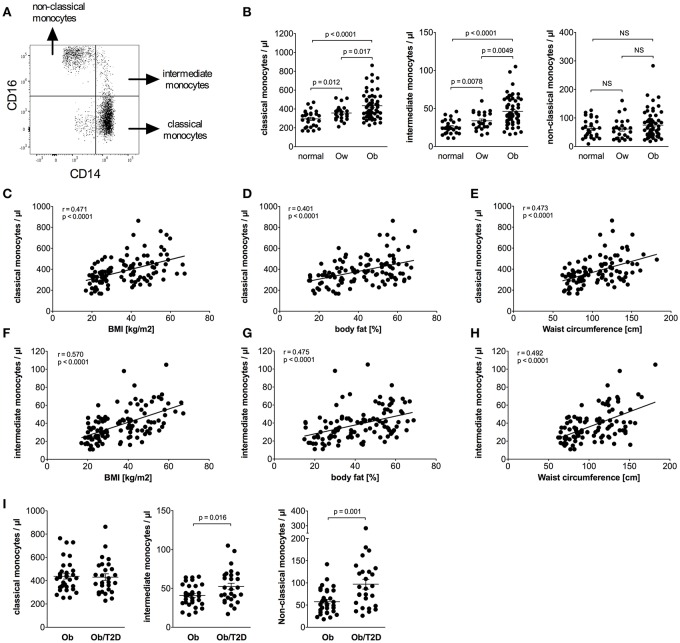
Quantification of classical, intermediate, and non-classical monocytes of normal, overweight, and obese individuals. (A) Representative dot plot of CD14 and CD16 expression on monocytes. (B) Absolute numbers of classical, intermediate, and non-classical monocytes of normal (n = 27), overweight (ow, n = 23), and obese (ob, n = 60) individuals. Scatter plots show mean ± SEM. (C–E) Correlation of classical monocyte numbers with BMI (C, n = 110), body fat (D, n = 108), and waist circumference (E, n = 101). (F–H) Correlation of intermediate monocyte numbers with BMI (F, n = 110), body fat (G, n = 108), and waist circumference (H, n = 101). (I) Absolute numbers of classical, intermediate, and non-classical monocytes of obese individuals with (Ob/T2D, n = 27) and without (Ob, n = 33) type 2 diabetes. Scatter plots show mean ± SEM.

