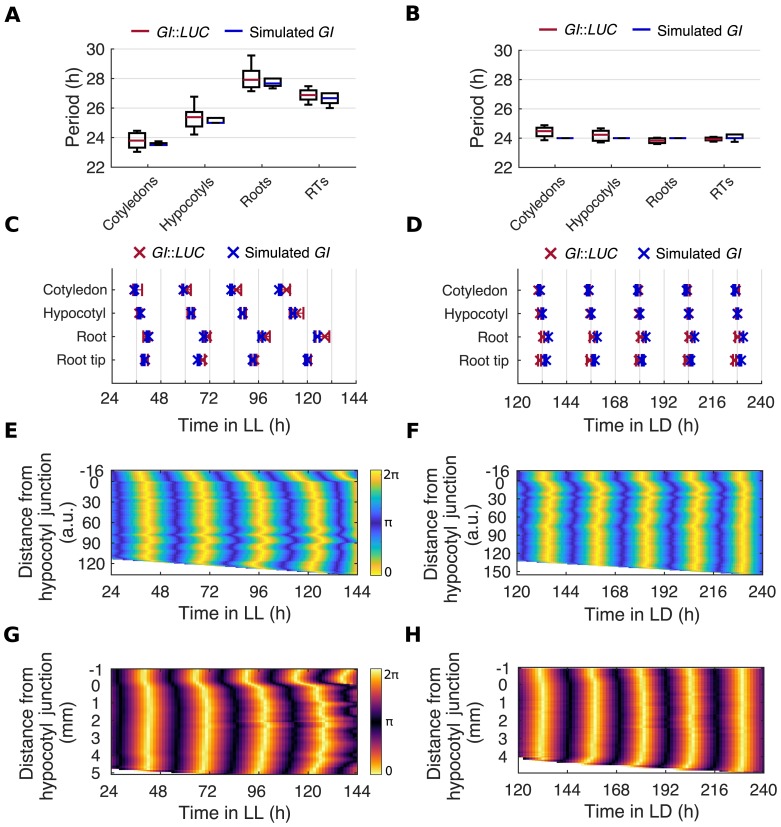
Fig 4. Period differences and local coupling can explain spatial waves of clock gene expression.
(A, B) Period estimates of GI::LUC and simulated GI for different organs imaged under LD-to-LL (A) and LD-to-LD (B) conditions. Box plots indicate the median and upper and lower quartiles, and whiskers the 9th and 91st percentiles of organs scored as rhythmic. (C, D) Times of peaks of expression of GI::LUC and simulated GI in different organs under LD-to-LL (C) or LD-to-LD (D) conditions. Plots represent the 25th percentile, median, and the 75th percentile for the peak times of the oscillations of organs scored as rhythmic. (E, F) Representative phase plot of simulated GI expression across longitudinal sections of the hypocotyl and root of a single seedling under LD-to-LL (E) or LD-to-LD (F) conditions. Color maps are as in E. (G, H). Representative phase plot of GI::LUC expression across longitudinal sections of the hypocotyl and root of a single seedling under LD-to-LL (G) and LD-to-LD (H) conditions. Color maps are as in G. For experimental data, N and n are as in Fig 2. For GI simulations, n = 24. N represents the number of independent experiments and n the total number of organs tracked. See S1 and S2 Files for exact n, test statistics, and percentage rhythmicity of each organ. Underlying data are available from https://gitlab.com/slcu/teamJL/greenwood_etal_2019. GI, GIGANTEA; LD, light-dark; LL, constant light; LUC, LUCIFERASE; RT, root tip.

