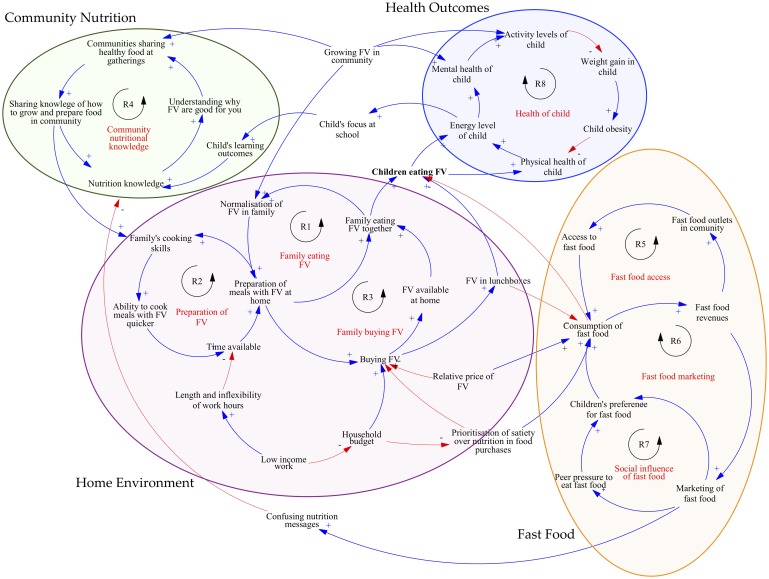
Fig 1. Community food system map (causal loop diagram).
A causal loop diagram (CLD) uses arrows to indicate a causal relationship between variables in a system [25]. The CLDs created in this study describe the causal connection between variables that workshop participants deemed to be important, highlighting the feedback processes that determine system behaviour [25]. A blue arrow with a plus symbol shows that the two variables move in the same direction; if the variable at the tail of the arrow increases or decreases, the variable at the head also increases or decreases, respectively. A red arrow with a minus symbol indicates that the two variables move in opposite directions: if the variable at the arrow tail increases, the variable at the head decreases (and vice versa). The causal loops within the CLD illustrate the way in which a chain effect of a cause can be traced through a set of related variables, back to the original cause [25]. All causal loops in this systems map are reinforcing, indicated with an R in the diagram, which means that they perpetuate either a vicious or virtuous cycle [25].

