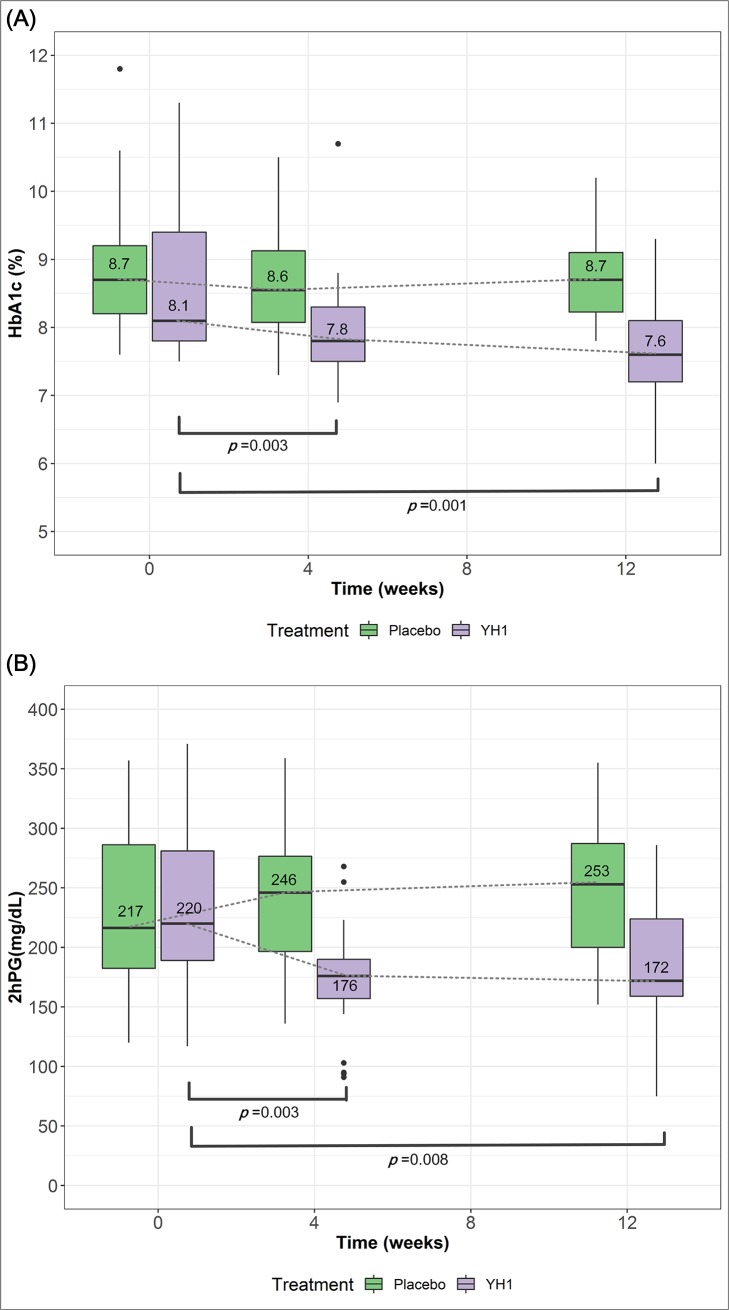
Fig 3. Primary outcomes (HbA1c) and secondary outcomes (2hPG) over 12 weeks.
The distribution of data (median, quartiles, range and outliers) for HbA1c (A) and 2hPG (B) in the YH1 and placebo groups at week 0, week 4, and week 12 are displayed in the boxplot. To analyze the changes in parameters from their baseline values, Wilcoxon signed-rank test was applied. A value of p < 0.05 was considered significant. In the boxplot (Fig 3A), there was a significant reduction in the median HbA1c value at week 4 (p = 0.003) and week 12 (p = 0.001) compared with the value at baseline in the YH1 group. In addition, the median 2hPG level from week 0 to week 12 declined significantly from 220 mg/dL to 172 mg/dL in the YH1 group (Fig 3B, p = 0.008). HbA1c, glycated hemoglobin; 2hPG, 2-hour postprandial glucose.

